Ethereum Is in a Horizontal Trend as It Trades above $2,200 Level
Estimated Reading Time: 2 minutes
Don’t invest unless you’re prepared to lose all the money you invest. This is a high-risk investment and you are unlikely to be protected if something goes wrong. Take 2 minutes to learn more

Ethereum Price Long-Term Analysis: Bullish
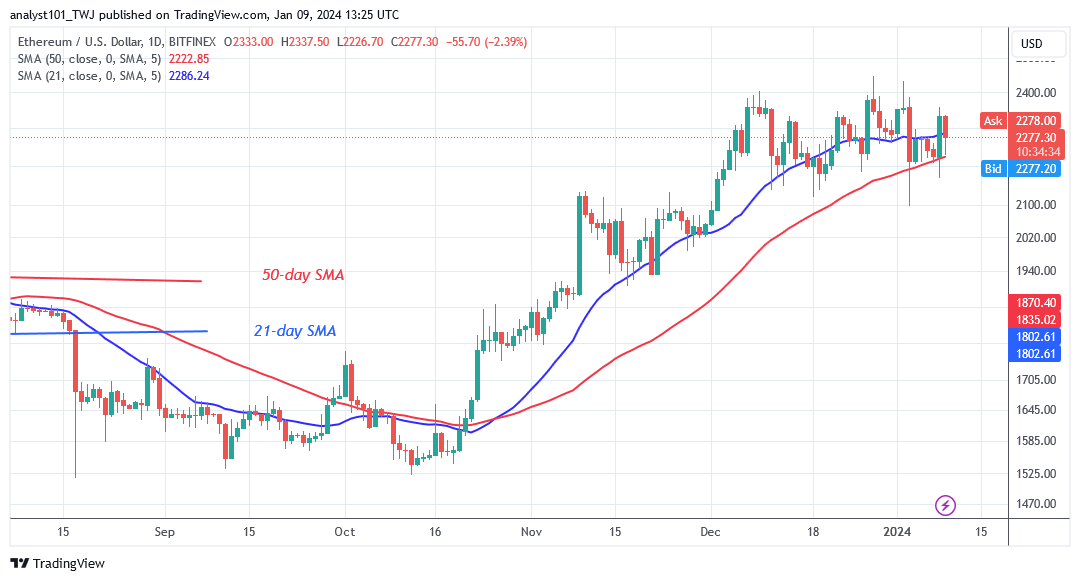
The price of Ethereum (ETH) rises and crosses above the 21-day SMA as it trades above the $2,200 level. Ether’s price has been stuck between the moving average lines since the market collapse on January 3. Ether surged to a high of $2,359 on January 8 before being pushed back. The cryptocurrency’s price has moved back between the moving average lines as a result of the rejection.
On the upside, the resistance levels at $2,300 and $2,400 have held back the higher movements. On the downside, the 50-day SMA and $2,200 support are regularly held by the bulls. If the bears break both the 50-day SMA and the present support, the selling pressure will pick up. ETH/USD will return to its earlier lows of $1,940 and $2,100.
Technical indicators:
Major Resistance Levels – $2, 600, $2,800, $3,000
Major Support Levels – $1.600, $1, 400, $1,200
Ethereum Indicator Analysis
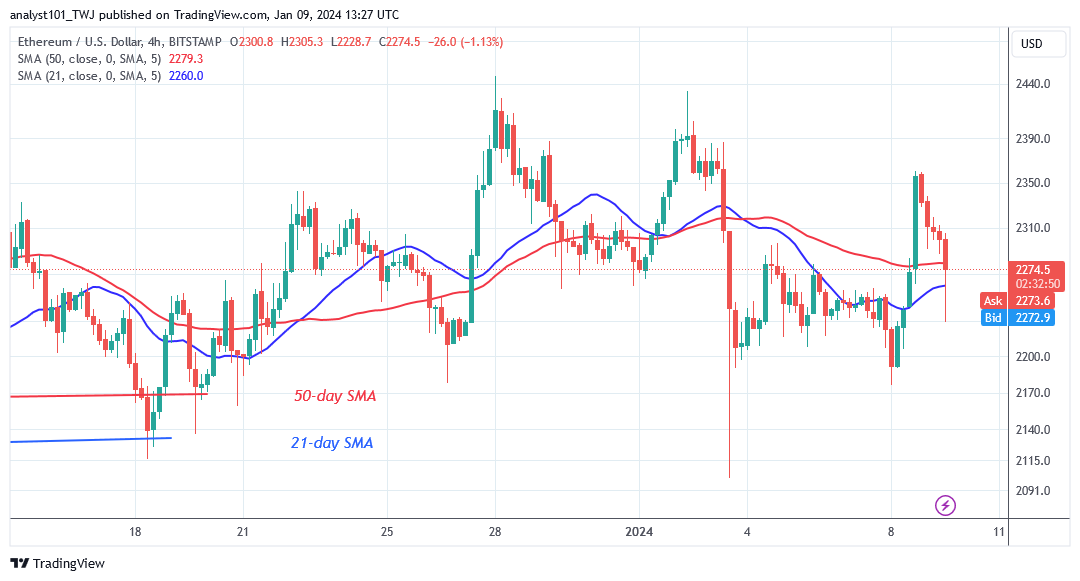
The price of Ether is back within the range of the moving average lines. The moving average lines on the 4-hour chart are horizontal, signifying the sideways trend that is now in place. The fact that the price bars on both charts are situated in between the moving average lines suggests that the cryptocurrency may fluctuate.
Conclusion
Ether’s horizontal pattern is continuing as it trades above the $2,200 level. The largest altcoin fluctuates between $2,200 and $2,400 in a narrow range. Ether will test the $2,400 resistance level each time the cryptocurrency closes above the 21-day SMA. Ether is currently retreating following a retesting of the resistance level.
You can buy crypto coins here. Buy LBLOCK
Note: Cryptosignals.org is not a financial advisor. Do your research before investing your funds in any financial asset or presented product or event. We are not responsible for your investing results