Bitcoin Cash (BCH/USD) Market Breaks Down at $500
Estimated Reading Time: 3 minutes
Don’t invest unless you’re prepared to lose all the money you invest. This is a high-risk investment and you are unlikely to be protected if something goes wrong. Take 2 minutes to learn more
Bitcoin Cash Price Prediction – December 10
It recorded currently that the BCH/USD market breaks down at a $500 lower range-line in a correction motion continuation bid to affirm that the crypto coin still succumbs to depression. The crypto economy is trading around $445 at an estimated percentage rate of about 0.81 negatives.
BCH/USD Market
Key Levels:
Resistance levels: $600, $700, $800
Support levels: $400, $300, $200
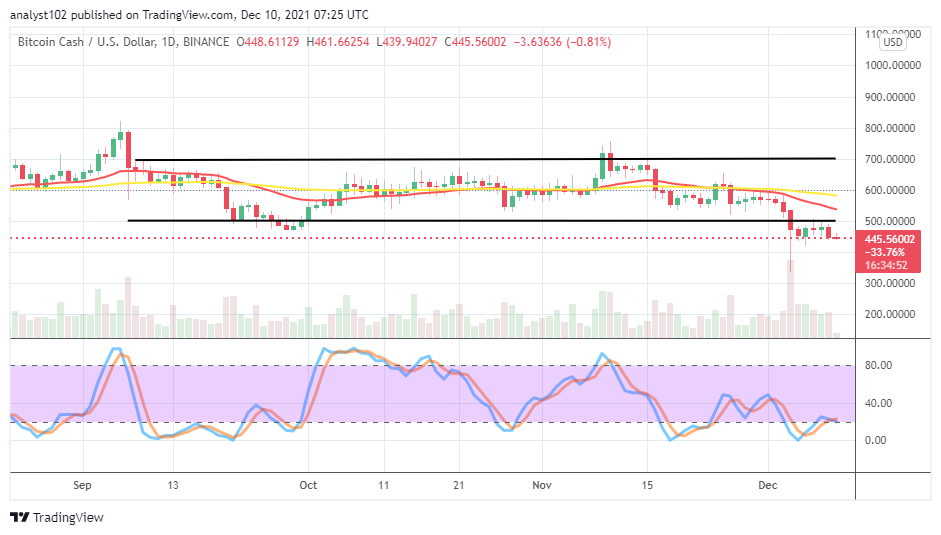
BCH/USD – Daily Chart
The BCH/USD daily chart showcases that the crypto market breaks down at $500 lower range-level, settling a new start of support trading levels more lowly. The SMA trend lines are within $600 and $500. The 50-day SMA indicator is above the 14-day SMA indicator. The Stochastic Oscillators have swung up from the oversold region, conjoining the lines at range 20 to indicate a possible consolidation moving style. That suggests that the base trading instrument may still hold down lowering against the US economy.
Will there still be more systemic bearish moves in the BCH/USD business activities as the market breaks down at a $500 lower psychological range level?
It now appears that the BCH/USD business activities are yet to come out of depression as the crypto market breaks down at a $500 lower psychological range level. A line of price convergences has featured in $500 and $400 trading levels after the emergence of a downturn in the market on the December 4th session. The market is currently trading at critical lower zones and, bulls would have to find strong support soon to build their stances.
On the downside of the technical analysis, the BCH/USD market bears have to keep the price under control by not allowing it to rebound sustainably against the $500 level. Instead, they would have to stage a firm resistance line around the point against any upward pushes attempt that the market may soon be tending to make. In the process of those assumptions playing out, another round of lower range-bound trading trends may achieve.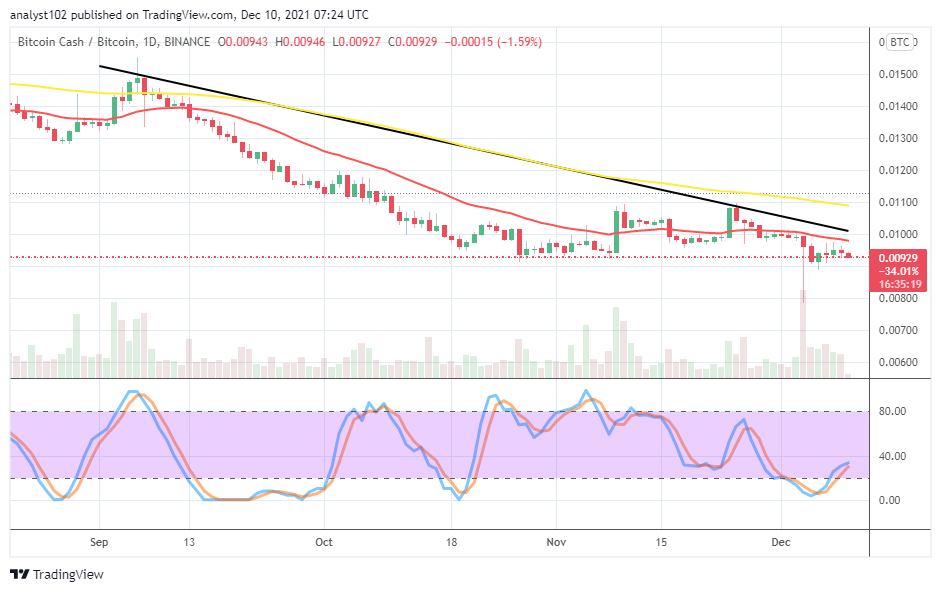
BCH/BTC Price Analysis
In comparison, the trending motion between Bitcoin Cash and Bitcoin still moves downward to constitute a bearish outlook. The cryptocurrency pair market breaks down lower beneath the trend lines of the SMAs. The 50-day SMA indicator is above the 14-day SMA indicator. The Stochastic Oscillators have moved northbound from the oversold region toward the range of 40 in a slanting manner, indicating the possibility that the market isn’t somewhat totally free from not going down.
Note: Cryptosignals.org is not a financial advisor. Do your research before investing your funds in any financial asset or presented product or event. We are not responsible for your investing results.
You can purchase crypto coins here. Buy Tokens