Ethereum Remains above $2,200 as It Continues Its Upward Trend
Estimated Reading Time: 2 minutes
Don’t invest unless you’re prepared to lose all the money you invest. This is a high-risk investment and you are unlikely to be protected if something goes wrong. Take 2 minutes to learn more
Ethereum Price Long-Term Analysis: Bullish
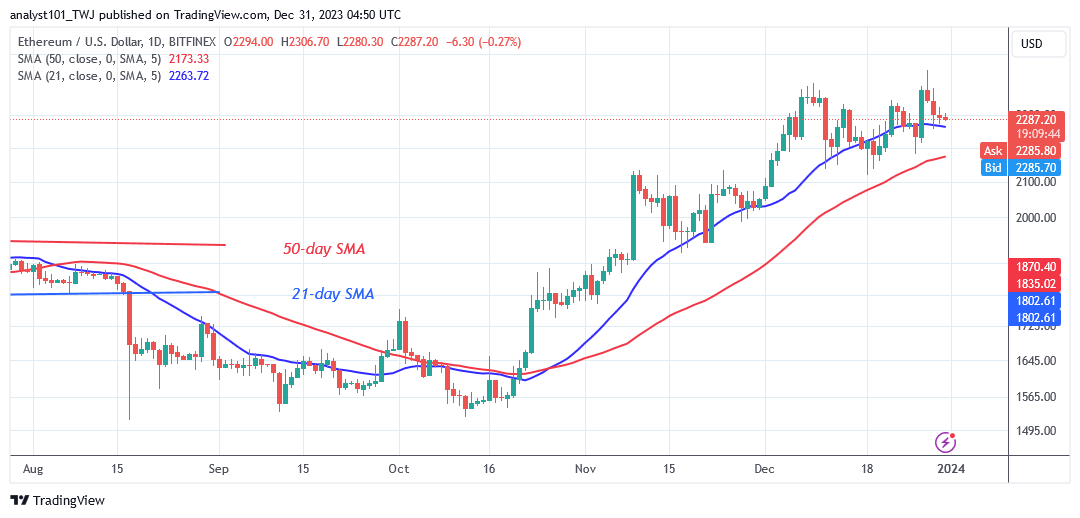
The price of Ethereum (ETH) finds support above the 21-day SMA as it continues its upward trend. The biggest altcoin has pulled back and is currently steadily rising above the 21-day SMA support, thanks to the formation of small, uncertain candlesticks, or Dojis. Ether is currently trading above the 21-day simple moving average, or $2,200.
Buyers have turned the 21-day simple moving average (SMA) into support as they aim to push Ether back to its prior high. Buyers are aiming to push the altcoin up to the psychological price barrier of $3,000. On December 28, the cryptocurrency surged to a high of $2,447 before being repulsed. ETH/USD is now valued $2,274.50.
Conversely, a return of selling pressure is indicated if the bears are able to break below the 21-day SMA support and sustain bearish momentum.
Technical indicators:
Major Resistance Levels – $2, 600, $2,800, $3,000
Major Support Levels – $1.600, $1, 400, $1,200
Ethereum Indicator Analysis
Although the price bars are above the 21-day SMA, the bears are threatening to short. The upward trend is supported by the 21-day SMA support. The appearance of Doji candlesticks has slowed the price movement. The moving average lines slope northward despite the sideways trend.
Conclusion
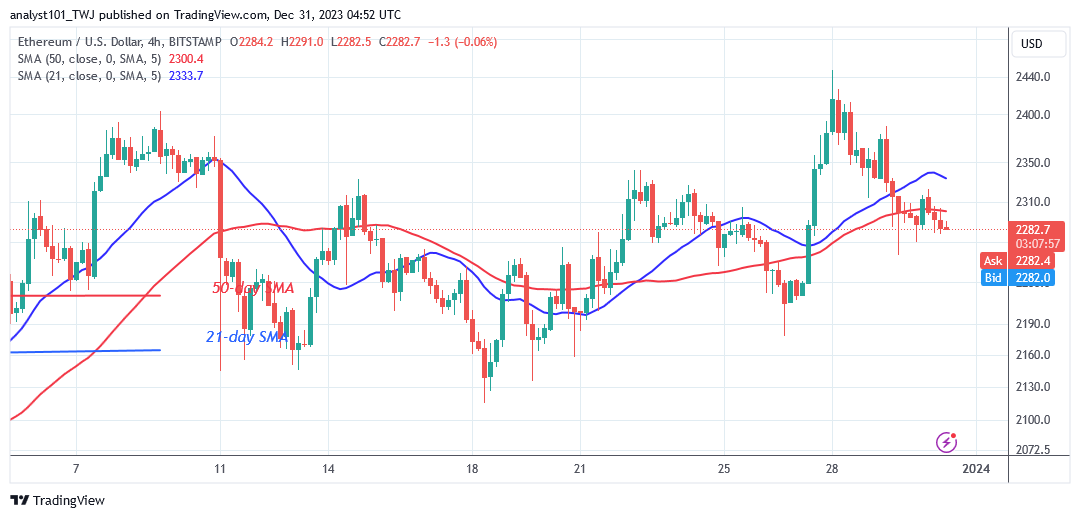
ETH/USD retraces above the 21-day simple moving average (SMA) as it continues its upward trend. When the current support levels are held, the largest altcoin will restart its bullish ascent. In addition, the altcoin has been trading in a range between $2,200 and $2,440. When the range bound levels are breached, Ether will either appreciate or depreciate.
You can buy crypto coins here. Buy LBLOCK
Note: Cryptosignals.org is not a financial advisor. Do your research before investing your funds in any financial asset or presented product or event. We are not responsible for your investing results