Ethereum Slumps but Holds above $2,200 as Bulls Buy the Dips
Estimated Reading Time: 2 minutes
Don’t invest unless you’re prepared to lose all the money you invest. This is a high-risk investment and you are unlikely to be protected if something goes wrong. Take 2 minutes to learn more

Ethereum Price Long-Term Analysis: Bearish
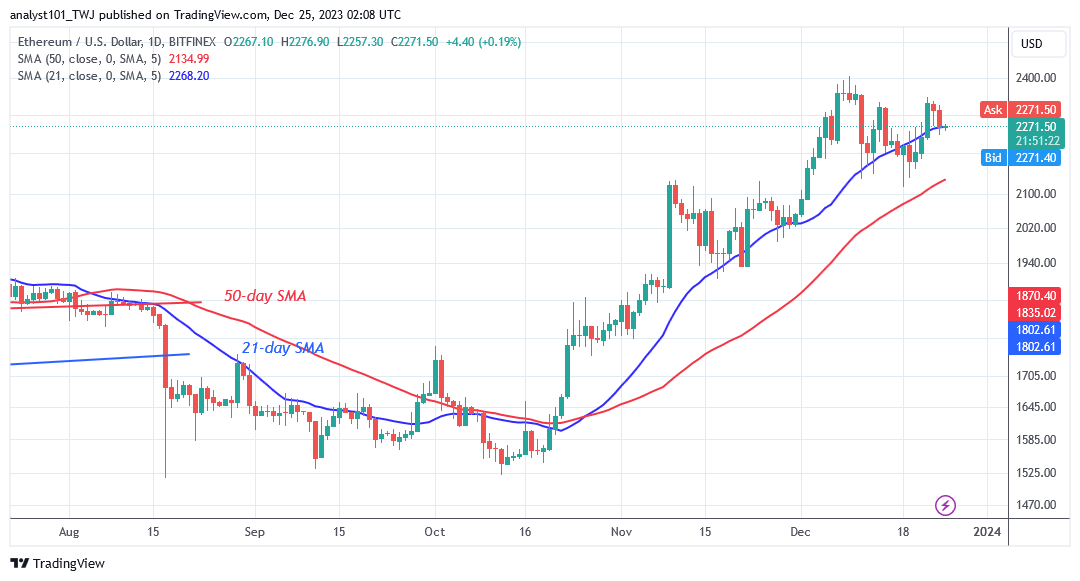
The price of Ethereum (ETH) is now trading in a narrow range as it slumps but holds above $2,200. The altcoin has now fallen below the 21-day $MA after reaching resistance at $2,300. Despite the drop, Ether remains above the $2,200 support level. Nonetheless, the altcoin risks decline following the breach of the 21-day SMA.
On the downside, the coin will fall above the $2,100 support or the 50-day simple moving average. The downtrend will commence if the price goes below the moving average lines. The price of ETH/USD will plummet to $1,931 low.
Technical indicators:
Major Resistance Levels – $2, 600, $2,800, $3,000
Major Support Levels – $1.600, $1, 400, $1,200
Ethereum Indicator Analysis
The largest altcoin has dropped between the moving average lines, indicating a possible sideways move. The 50-day SMA will be the next level of support. Ether will be compelled to trade in a range between the moving average lines if the 50-day $MA support holds.
Conclusion
Ether approaches the psychological price level of $2,000 and the 50-day moving average but holds above $2,200. The largest altcoin will restart its downward trend once the psychological price threshold is crossed. The current uptrend will continue if the important support levels are kept at current levels.
You can buy crypto coins here. Buy LBLOCK
Note: Cryptosignals.org is not a financial advisor. Do your research before investing your funds in any financial asset or presented product or event. We are not responsible for your investing results

