Ethereum Hovers Above $2,000 as Bears Pose a Threat to Short
Estimated Reading Time: 2 minutes
Don’t invest unless you’re prepared to lose all the money you invest. This is a high-risk investment and you are unlikely to be protected if something goes wrong. Take 2 minutes to learn more

Ethereum Price Long-Term Analysis: Bearish
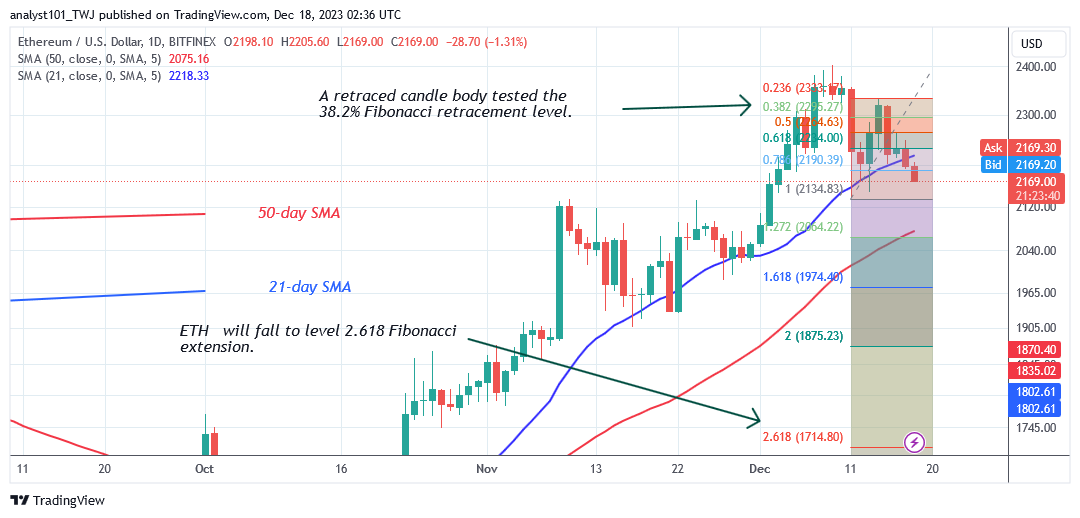
The price of Ethereum (ETH) may resume selling pressure as bears pose a threat to short. The present rally has come to an end as Ether has been rejected twice at the recent high. The largest altcoin is now trading below the 21-day SMA but above the 50-day SMA. The coin has plunged to a low of $2,177.80 at the time of writing. On the downside, bearish momentum will extend to a low above the 50-day SMA or $2,100 mark.
ETH/USD will be trapped between the moving average lines if it retraces and finds support above the 50-day SMA. However, if the crypto’s price falls below the moving average lines, the bearish momentum will extend to the $1,800 and $1,709 price levels.
Technical indicators:
Major Resistance Levels – $2, 600, $2,800, $3,000
Major Support Levels – $1.600, $1, 400, $1,200
Ethereum Indicator Analysis
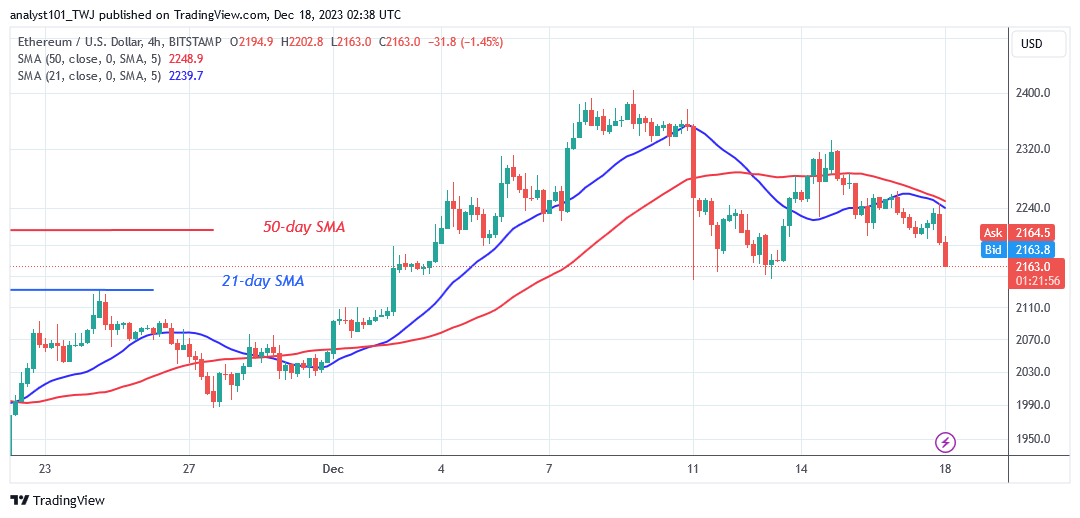
Following a recent fall, the price of Ether is now trading between the moving average lines. The next level of support will be above the 50-day simple moving average. The moving average lines are pointing northward after the most recent decline. On the 4-hour chart, however, the moving average lines are sloping downward.
Conclusion
ETH/USD is in decline as bears pose a threat to short. The cryptocurrency stays above the psychological price barrier of $2,000 even as it corrects higher. The price indication suggested that the cryptocurrency would continue to fall. If the bears break below the moving average lines, ETH will fall to the 2.618 Fibonacci extension or $1,714.80.
You can buy crypto coins here. Buy LBLOCK
Note: Cryptosignals.org is not a financial advisor. Do your research before investing your funds in any financial asset or presented product or event. We are not responsible for your investing results