Lucky Block Price Prediction: LBLOCK/USD Will Break Above $0.0015 Level
Estimated Reading Time: 2 minutes
Don’t invest unless you’re prepared to lose all the money you invest. This is a high-risk investment and you are unlikely to be protected if something goes wrong. Take 2 minutes to learn more

Free Crypto Signals Channel
In case the bulls increase their momentum, the Lucky Block price prediction will break up the $0.0015 level to hit the $0.0020 and $0.0022 resistance levels.
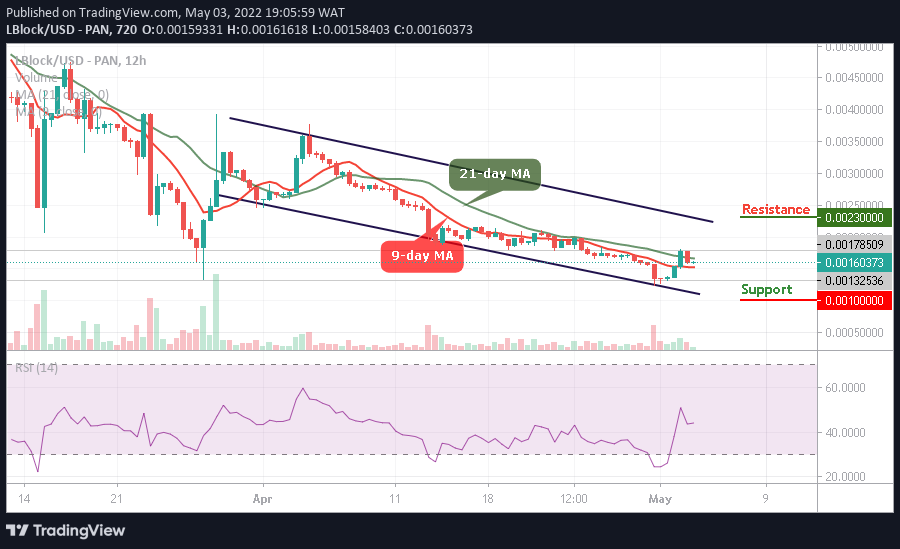
LBLOCK/USD Medium-term Trend: Bearish (12H Chart)
Key Levels:
Resistance levels: $0.0023, $0.0025, $0.0027
Support levels: $0.0010, $0.0008, $0.0006
LBLOCK/USD is above the 9-day and 21-day moving averages as the bullish pressure would prepare to break up the resistance level of $0.0015 level. Nevertheless, if the bulls fail to push the price to the north, the Lucky block price will consolidate for a while to allow more buyers to buy the dip.
Lucky Block Price Prediction: LBLOCK/USD Will Head to the North
The Lucky Block price is changing hands at $0.0015 where it retreats slightly, but if the coin continues the current movement and crosses above the 9-day and 21-day moving averages, the coin may locate the potential resistance levels at $0.0023, $0.0025, and $0.0027 while the support levels may come at $0.0010, $0.0008, and $0.0006 which could allow the new entries as the technical indicator Relative Strength Index (14) moves in the same direction above 40-level.
LBLOCK/USD Medium-term Trend: Bearish (4H Chart)
On the 4-hour chart, the Lucky Block price trades below the 9-day moving average which may head to the south. Meanwhile, the technical indicator Relative Strength Index (14) confirms that the coin will move sideways but any bullish movement towards the upper boundary of the channel will hit the resistance level at $0.0019 and above.
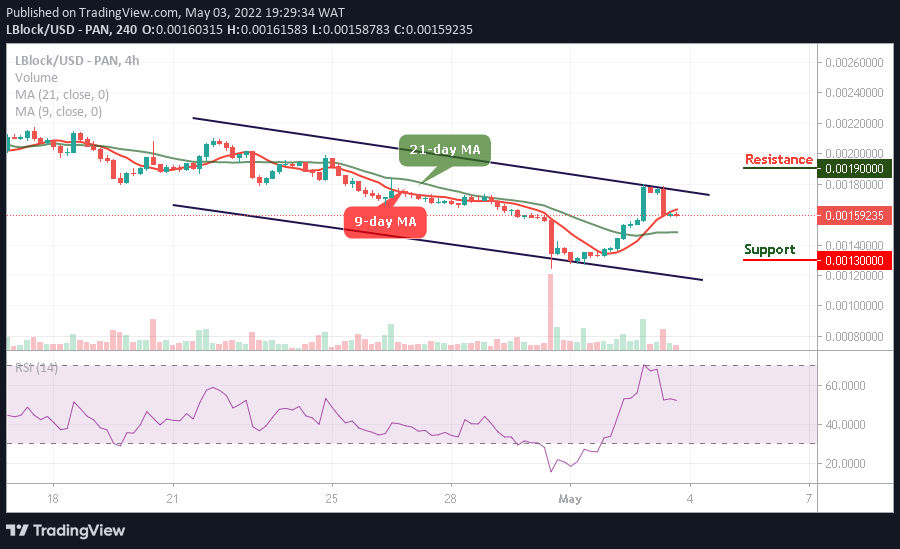
However, LBLOCK/USD would experience more bullish signals once the price crosses above the 9-day MA but if the price drop below the current market value, it will be an opportunity for new buyers to come into the market as the Lucky Block price could touch the support at $0.0013 and below.
Read more: