BNB Price Feels the Altcoin Chill Amid Macro-Trend Breakdown
Estimated Reading Time: 3 minutes
Don’t invest unless you’re prepared to lose all the money you invest. This is a high-risk investment and you are unlikely to be protected if something goes wrong. Take 2 minutes to learn more
The market for BNB against Tether has slipped 3.05% towards $626 over the last 24 hours. As it stands, investors are retreating into the market leader’s relative safety, with capital rotating out of altcoins amidst a climate of extreme market fear.
Technically, the BNB price still maintains its $600 psychological support limit as the price consolidates. However, a dip below this level could trigger a move towards $576. Meanwhile, a shift in the Altcoin season indicator will signal recovery or a prolonged downtrend as the price struggles to hold on to its current level.
Currently, BNB trades at $626 with more than 61,000 traded volumes on the daily chart.
Technical Indicator
Major Resistance Levels: $640, $650, and $680
Major Support Levels: $622, $600, and $580
BNB Displays Calmness; What’s Next?
In a post on X, @TonTraderCom, a BNB analyst, has suggested that BNB is currently compressing, moving sideways around $644. The analyst pointed to a tight range established between $642 and $646 on the 5-minute timeframe, suggesting narrowing volatility and equilibrium.
Additionally, the trader is of the opinion that the bulls are defending the current level, and as the market’s bullish participants continue to defend the support level, anticipation leans towards a breakout.
👀 BNB is quietly setting something up… 👇$BNB is moving sideways around $644 after a pullback, and the price action is getting tighter.
What stands out:
• Clear range between $642 and $646
• Buyers defending the $642–643 zone repeatedly
• Volatility compressing on the 5m… pic.twitter.com/4Kzu7bpOYU— TonTrader (@TonTraderCom) February 8, 2026
Technical Analysis
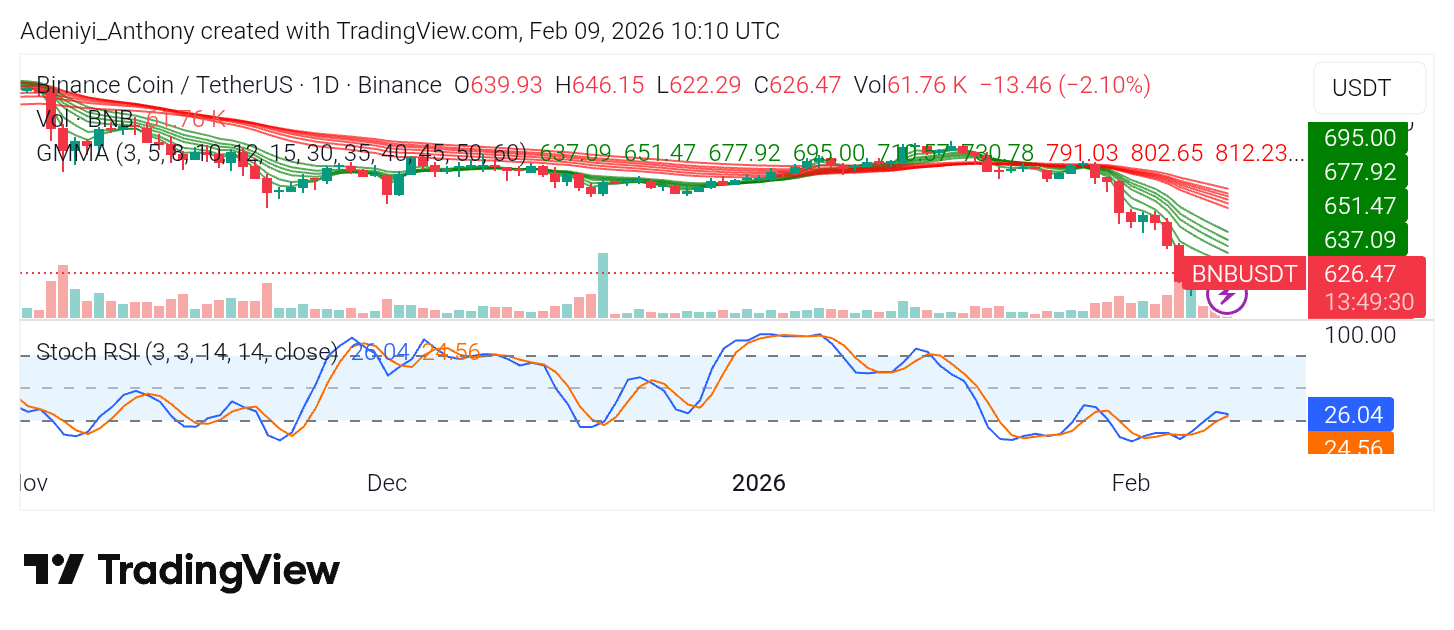
On the daily timeframe, BNB price is moving further south after months of oscillating within the $640 and $680 zone. The Guppy Multiple Moving Averages (GMMA) appears to be confirming this downtrend with diverging sets of exponential moving averages as the price action signals the influence of the sellers.
Beneath the chart, the Stochastic RSI is slightly above the oversold region, though not extremely oversold, but the direction of the lines shows no reversal in play at the moment. To this end, if the bulls can hold the current level, the pair might consolidate before any relief bounce towards $640.
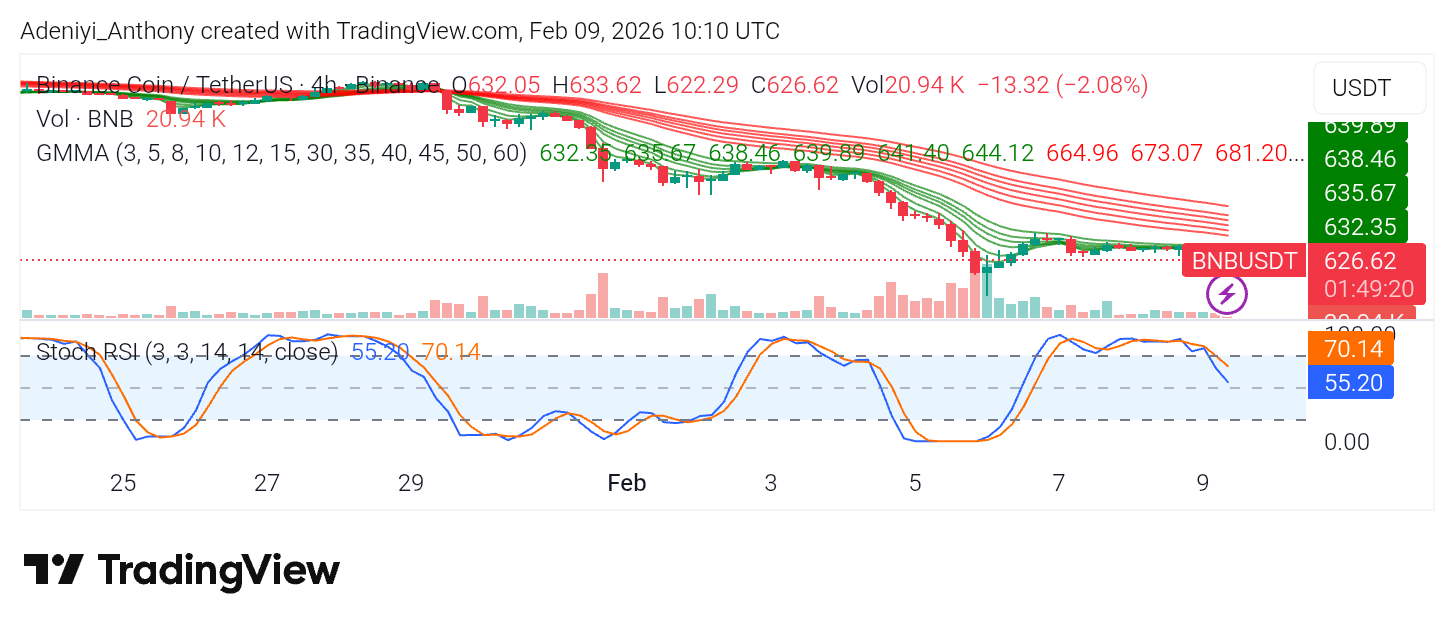
BNB/USDT Analysis: Short-term BNB Price Volatility: What’s Next?
On the 4-hour chart, the BNB price appears to be stabilizing with the EMAs moving sideways after the recent dip. Meanwhile, the stochastic oscillator seems to be heading south, extending towards the 55-mark level, portraying the downtrend on the daily timeframe.
However, as the momentum oscillator approaches the mid-level and the price tends to $615, the bulls may capitalize on this low to revive interest, but volume is still low. To this end, if volume in support of the buyers fails to materialize, the $600 psychological level will be exposed.
You can purchase crypto coins here. Buy Crypto