BNB Price Plummets Toward Critical Support as Sellers Overpower Bulls
Estimated Reading Time: 4 minutes
Don’t invest unless you’re prepared to lose all the money you invest. This is a high-risk investment and you are unlikely to be protected if something goes wrong. Take 2 minutes to learn more
The market for BNB against Tether has dropped 5.43% in the last 24 hours, extending its weekly decline to 15%. The market has not seen upside for some time as the BNB price dips below the broader crypto market’s slump. As it stands, it has been noticed that this downturn is primarily fueled by a market-wide selloff triggered by Bitcoin falling below $80,000, suggesting massive capital flow away from altcoins as investors consider other safe assets.
Meanwhile, from the technical perspective, the BNB price has breached key support levels, and while its RSI indicates oversold conditions, no clear reversal sign is in sight. Additionally, it appears that more pressure on this token stems from renewed regulatory uncertainty and shifting perceptions regarding Binance’s leadership.
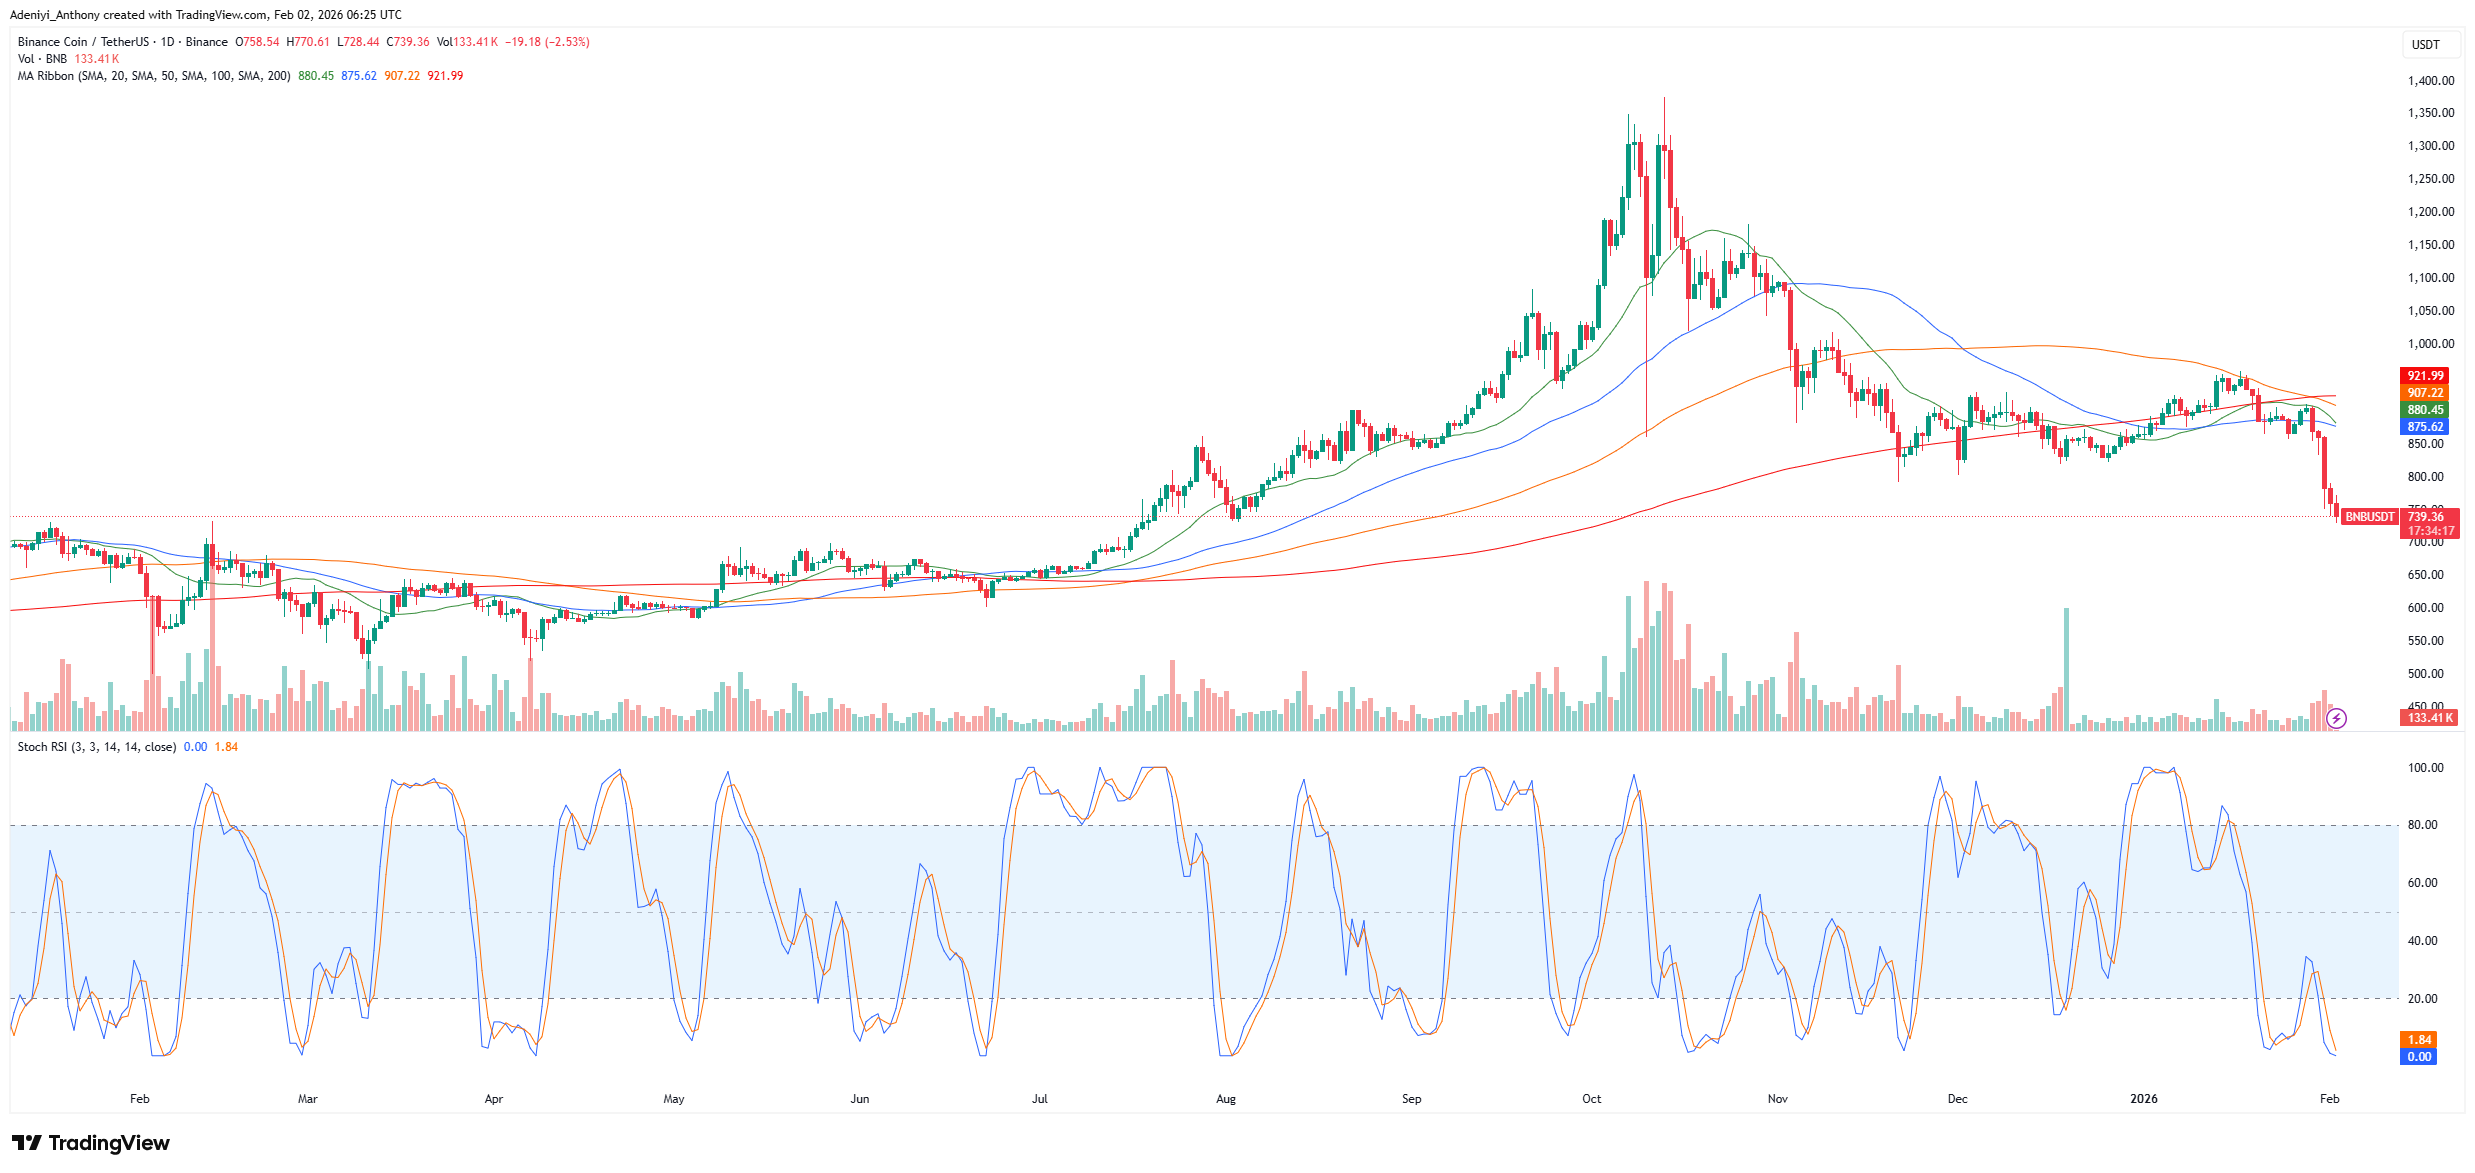
Currently, BNB trades at $739.36, with more than 133,000 volumes traded on the daily chart.
Technical Indicators
Major Resistance Levels: $800, $880, and $921
Major Support Levels: $720, $650, and $630
Technical Analysis
Technically, the BNB against Tether on the daily chart remains bearish, as price action continues to be below the 20 to 200 SMAs. As it stands, the stance suggests that the sellers are in control, as the BNB price continues to plummet further.
It has also been observed on the 24-hour timeframe that the sellers are maintaining control of the market. This is noticeable as the bears push the price below the $800 psychological support. However, it appears the current Stochastic RSI condition hints at a possible relief bounce, but the current oversold condition suggests total domination, and until a bullish crossover is spotted, the price has to test the $720 support level.
In a post by @traderteros, it was suggested that BNB is currently in a markdown phase. It was highlighted by the trader as a period of lower highs formation, with the prevalence of strong sell-offs. It was emphasized in the post that the apparent bullish divergences are misleading signs of distribution rather than a market bottom. To this, the trader advises that the prevailing trend remains weak, as the recent bounces lack the necessary follow-through for a reversal.
🚨 $BNB 🚨
Many beginners see a bullish divergence and think:
“Bottom is in. Time to buy.”BNB is in a Markdown phase.
That means:
Lower highs
Lower lowsStrong sell-off (Sign of Weakness)
Weak bounces with no follow-through📌 This is distribution playing out, not… pic.twitter.com/f53lM0jC9g
— FiboSamurai (@traderteros) February 2, 2026
BNB/USDT Analysis: Downward Trend Intensified as BNB Price Weakens
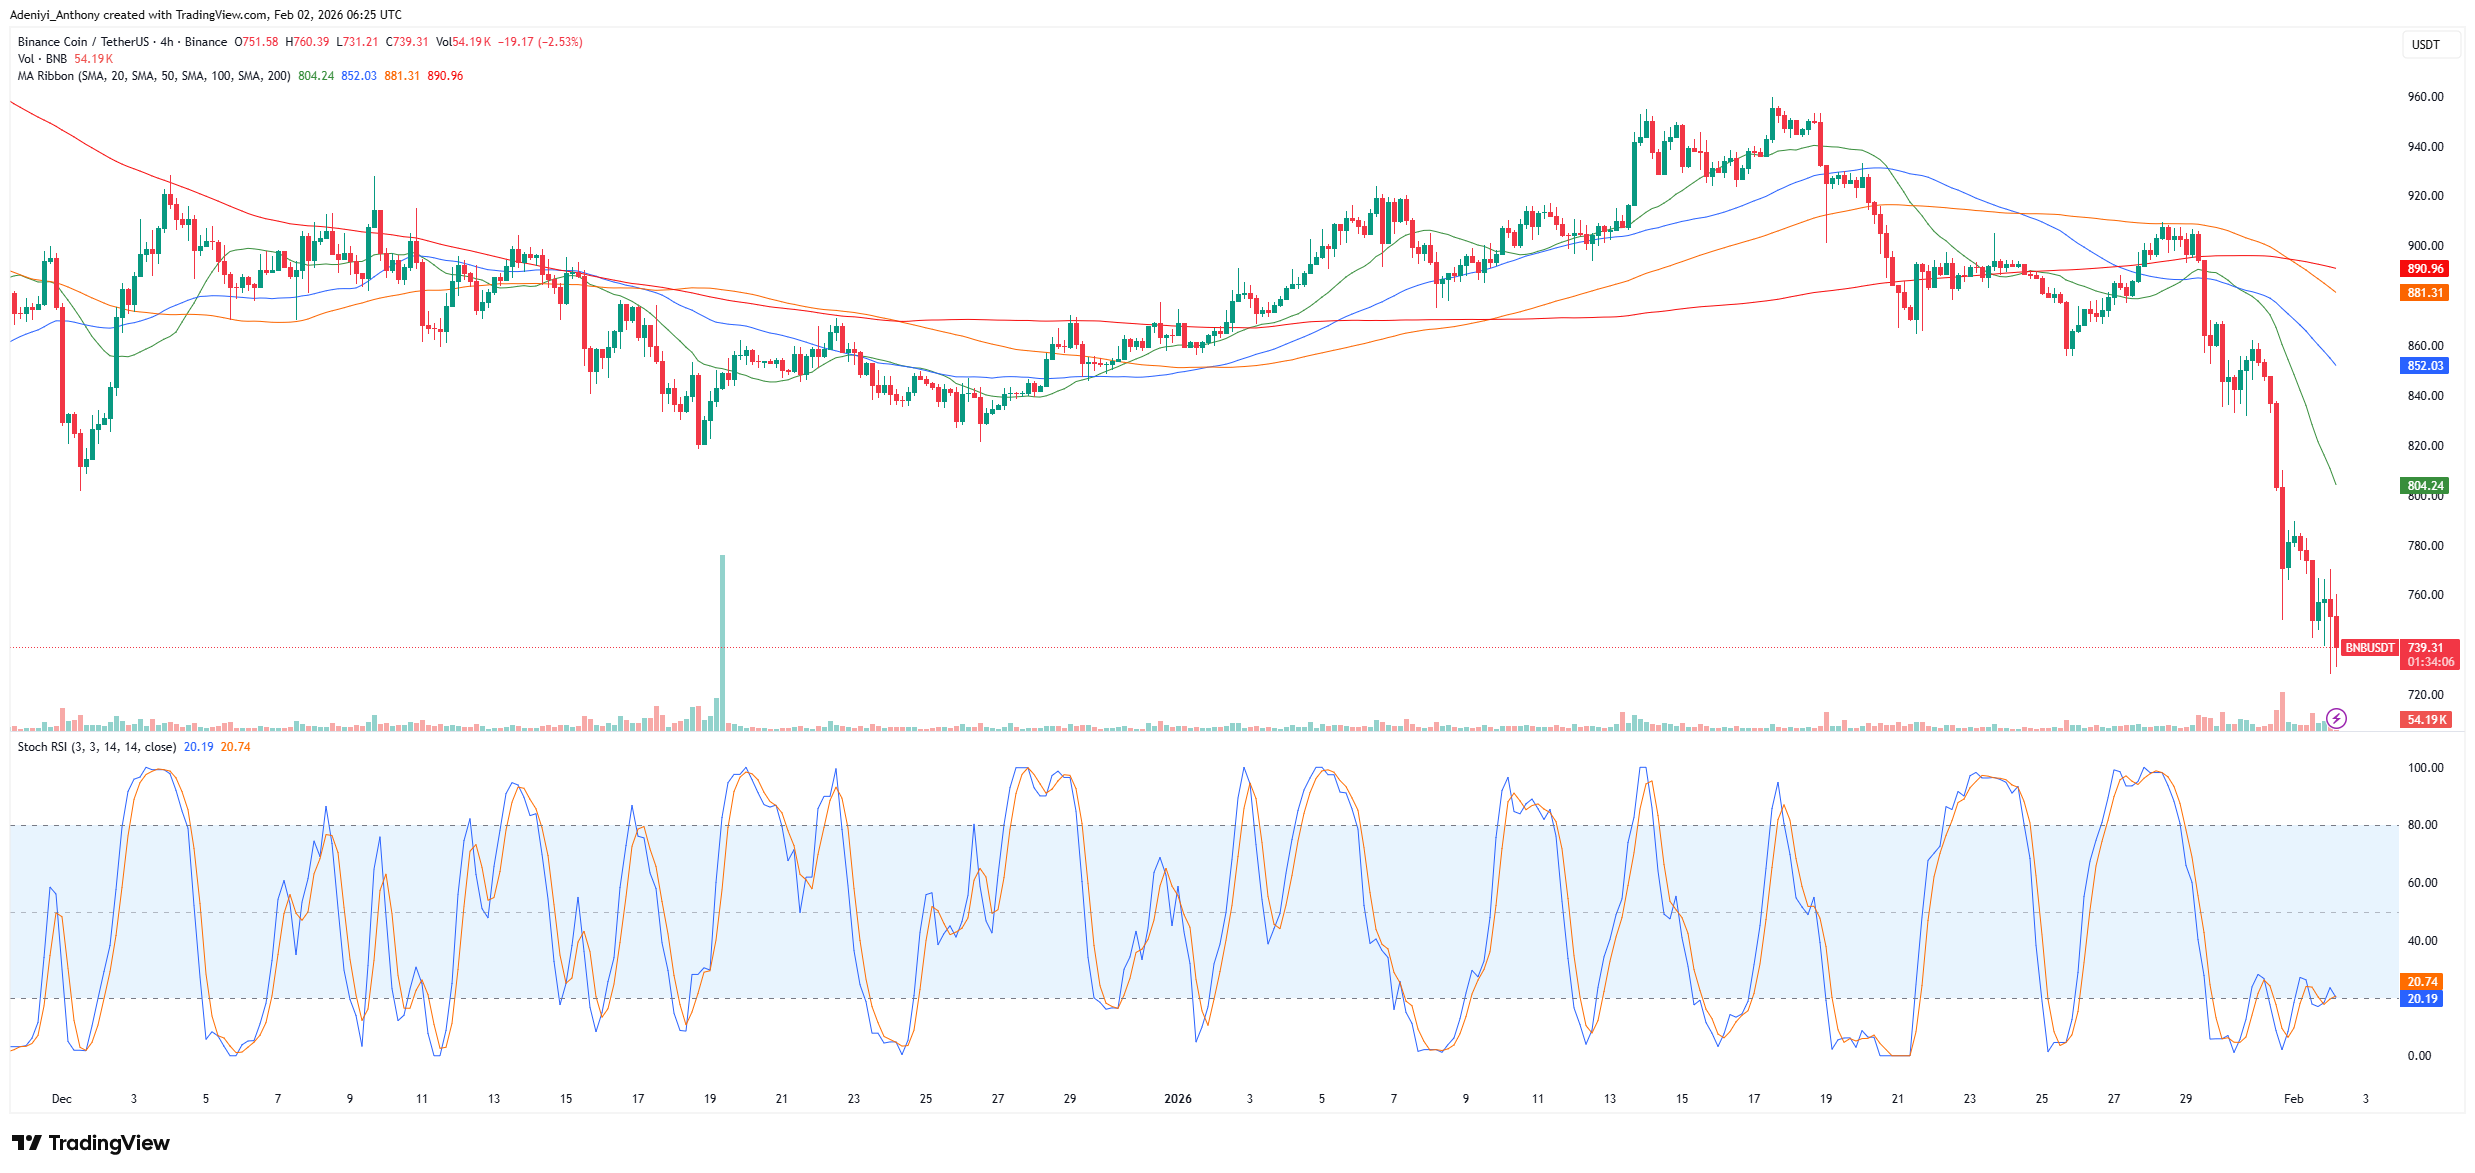
The market for BNB/USDT on the 4-hour timeframe shows no exception to the daily session. Apparently, the BNB price heads to the south with the cluster of moving averages acting as dynamic resistance. As it stands, even on a shorter timeframe, the bears are establishing their reign. However, the positioning of the Stochastic RSI, though it confirmed immediate bearish action, speaks of an impending bounce.
To this end, if the price fails to hold above the 739-$720 level till the stochastic provides a clearer crossover for the price to reclaim the nearest moving average, more downside could be recorded.
You can purchase crypto coins here. Buy Crypto