ZRXUSD Price Indicates Selling Tendency
Estimated Reading Time: 3 minutes
Don’t invest unless you’re prepared to lose all the money you invest. This is a high-risk investment and you are unlikely to be protected if something goes wrong. Take 2 minutes to learn more

Free Crypto Signals Channel
ZRXUSD Analysis – The Price Signals Room for Selling Tendency Below the $0.39200 Key Zone
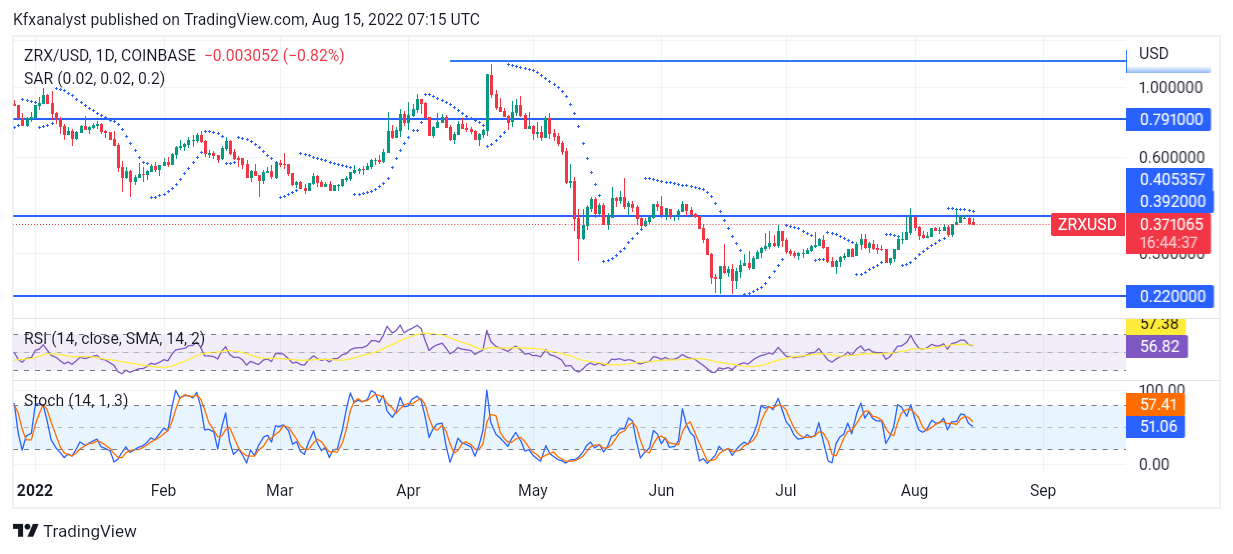
The ZRXUSD price indicates a selling tendency below the $0.39200 key zone. The market action for the new week is currently opening up for selling tendencies following the price hit at the $0.39200 key zone. The reason for sellers now creating orders could be a consequence of the price’s inability to break through the $0.39200 mark in recent times. The buy traders already made an initial attempt across the market the previous week but failed as the sellers caused the ZRXUSD price to retrace.
ZRXUSD Trade Levels
Resistance Levels: $1.15200, $0.79100
Support Levels: $0.39200, $0.22000
Buyers’ failure will therefore give sellers a charge to cause retracement backward until enough pressure can overcome the $0.39200 key zone. The sellers have been on the close edge of the price activity for months. The month of May was seen clearly for bearish deployment across the ZRXUSD price. Although the buy traders were in action also, with little contribution because of the sell liquidity impact. The sellers were ready to deploy orders as the price dropped from $1.15200 to $0.22000, the key zone.
Since buyers began to pick up strength in the ZRXUSD price market, that buying strength has failed to cause a break upward above the $0.39200 significant zone. The Stochastic Oscillator, which is a leading indicator, has pointed attention toward selling action, as is already indicated on the daily chart. The same has also been seen on the RSI (Relative Strength Index) indicator. The sellers can decide to go lower down to $0.22000 as a significant level of selling moments persist on the daily chart.
ZRXUSD Expectation
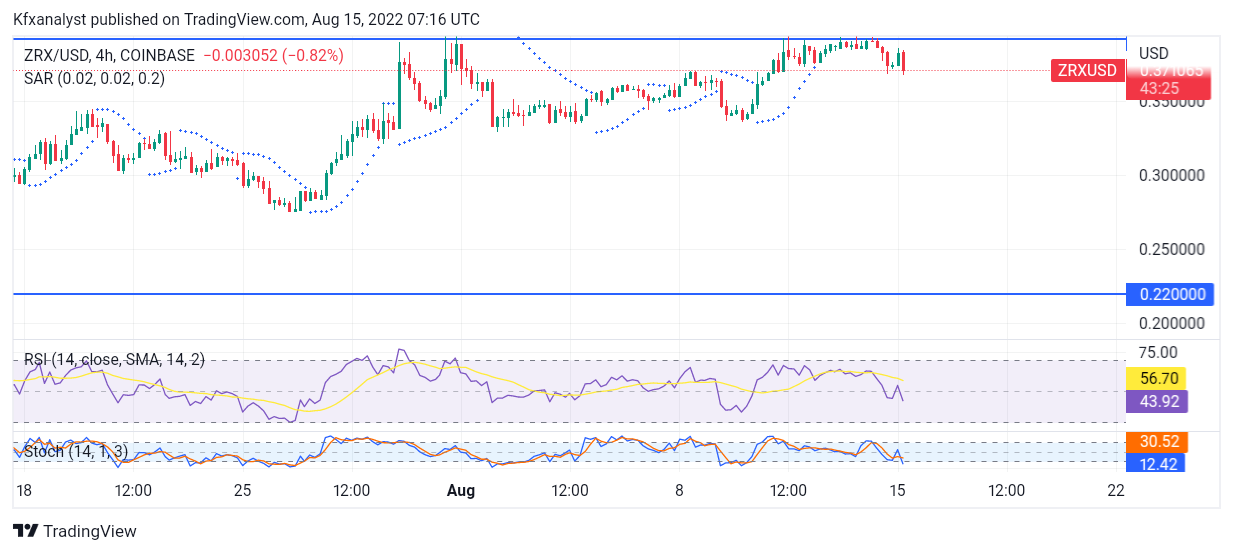
The selling tendency is now positioned for deployment downward. The Relative Strength Index is poised downward as the selling inclination is already set on a course on the 4hr chart. The selling phase can either be a short retracement or a long drop down towards the $0.22000 key zone.
You can purchase Lucky Block here. Buy LBLOCK
Note: Cryptosignals.org is not a financial advisor. Do your research before investing your funds in any financial asset or presented product or event. We are not responsible for your investing results.