Ripple (XRP) Retraces but May Hold Above the $1.08 Support
Estimated Reading Time: 2 minutes
Don’t invest unless you’re prepared to lose all the money you invest. This is a high-risk investment and you are unlikely to be protected if something goes wrong. Take 2 minutes to learn more

Ripple (XRP) Long-Term Analysis: Bullish
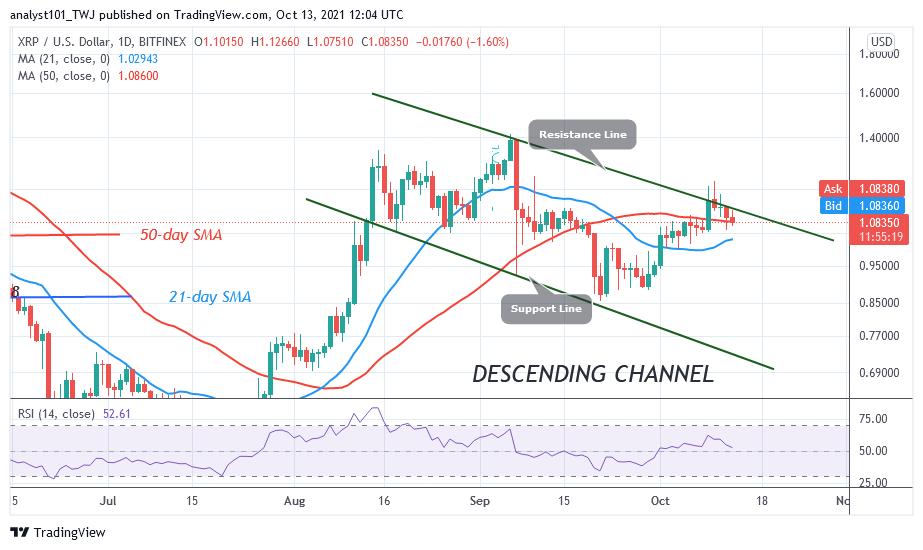
Since October 10, Ripple’s (XRP) price has been in a downward move. The altcoin has been retracing from the high of $1.20 as it reaches the low of $1.08. The candlestick has fallen above the 50-day line SMA. XRP will resume an uptrend if the 50-day line SMA support holds. The crypto will retest or break the $1.20 resistance which will catapult it to the high of $1.40. However, the selling pressure will resume if the 50-day line SMA is breached. That is, the market will decline to the low of $1.03.
Ripple (XRP) Indicator Analysis
Ripple is at level 52 of the Relative Strength Index period 14. The altcoin is in the bullish trend zone and capable of a further upward move. The crypto’s price is above the moving averages which indicates a further upward movement of the crypto. XRP is below the 20% area of the daily stochastic. The altcoin has fallen to the oversold region of the market. Further selling pressure is unlikely. Buyers are likely to emerge in the oversold region.
Technical indicators:
Major Resistance Levels – $2.00, $2.50, $3.00
Major Support Levels – $1.50, $1.00, $0.50
What Is the Next Direction for Ripple (XRP)
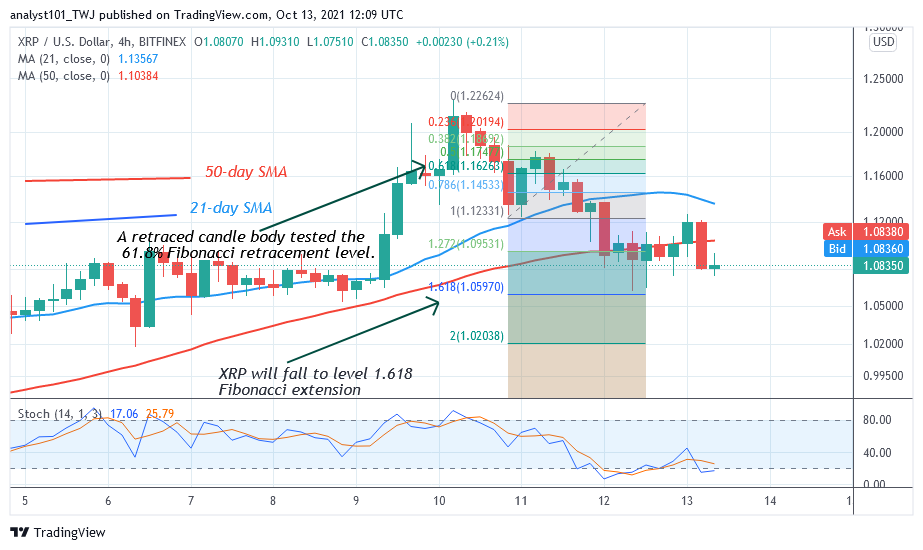
On the 4- hour chart, Ripple fell to the support above $1.08 low. There bullish candlesticks indicating a possible upward move. Meanwhile, on October 10 downtrend; a retraced candle body tested the 61.8% Fibonacci retracement level. The retracement indicates that XRP price will fall to level 1.618 Fibonacci extension or $1.05.
You can purchase crypto coins here. Buy Tokens
Note: Cryptosignals.org is not a financial advisor. Do your research before investing your funds in any financial asset or presented product or event. We are not responsible for your investing results