Uniswap (UNI) Price Prediction: UNI/USDT Retreats Below Key Marks
Estimated Reading Time: 3 minutes
Don’t invest unless you’re prepared to lose all the money you invest. This is a high-risk investment and you are unlikely to be protected if something goes wrong. Take 2 minutes to learn more
Uniswap (UNI) Price Prediction: August 22
The Uniswap market witnessed a strong upward price increase when Bitcoin resumed trading above the $60,000 threshold. However, the coin failed to progress further past the $61,000 mark and instead regressed toward the $60,000 threshold. This has had a direct effect on the UNI/USDT market as well, causing its price action to retreat below some technical marks.
UNI/USDT Long-term Trend: Bullish (Daily Chart)
Key Price Levels:
Resistance: $7.00, $8.00, $9.00
Support: $6.00, $5.00, $4.00
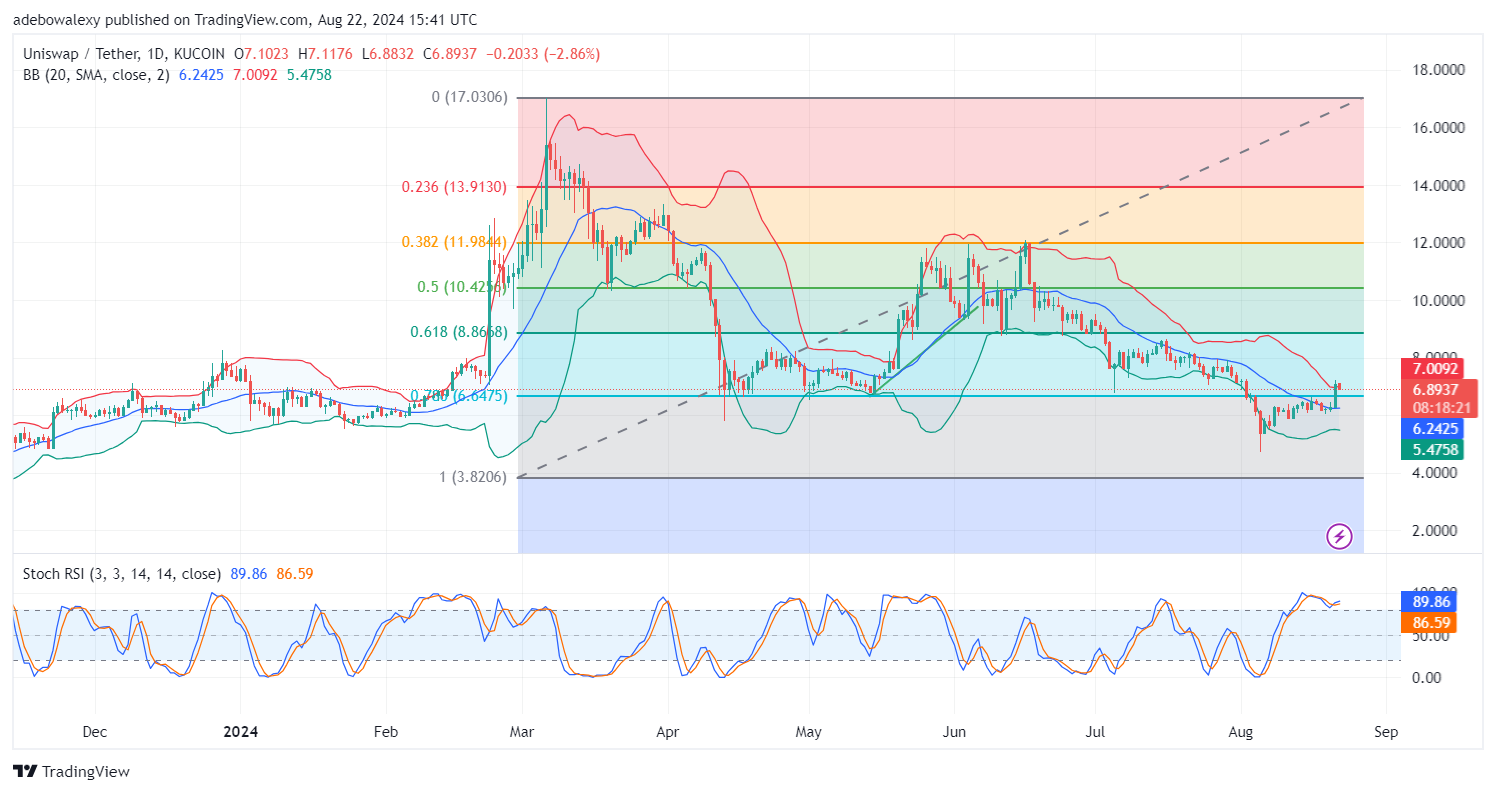
The UNI/USDT daily market appears to have found support at the middle limit of the Bollinger Bands (BB) indicator. However, price action has retreated below the uppermost limit of the BB indicator. Nevertheless, the coin continues to trade above the 78.60 Fibonacci Retracement level. Similarly, the Stochastic Relative Strength Index (Stochastic RSI) can be seen above the 80 mark, projected slightly upward.
Uniswap (UNI) Price Prediction: UNI/USDT Sees a Minimal Downward Retracement
Price activity in the Uniswap daily market has seen a moderate upside move in the previous session. This seems to have attracted short traders who swung into action, forcing the market to retreat below the uppermost limit of the Bollinger Bands. However, bulls are still holding on to a significant part of the upside gains seen in the previous session.
This has also kept the Stochastic RSI lines projected slightly upward. Consequently, this hints that the price action may still use the 78.60 Fibonacci Retracement level as support for an upside leap, provided favorable impetus sets in.
Uniswap (UNI) Price Prediction: UNI/USDT Downward Retracement Expounded (4-Hour Chart)
Price movement in the Uniswap 4-hour market has revealed the downward rejection earlier noticed in the daily market. Price action can be seen returning steadily below the uppermost band of the BB indicator. The ongoing session has produced a continued downward retracement of the $7.00 resistance. Be that as it may, the BB indicator itself maintains an upward trajectory, while price action remains above the mid-band of the indicator.
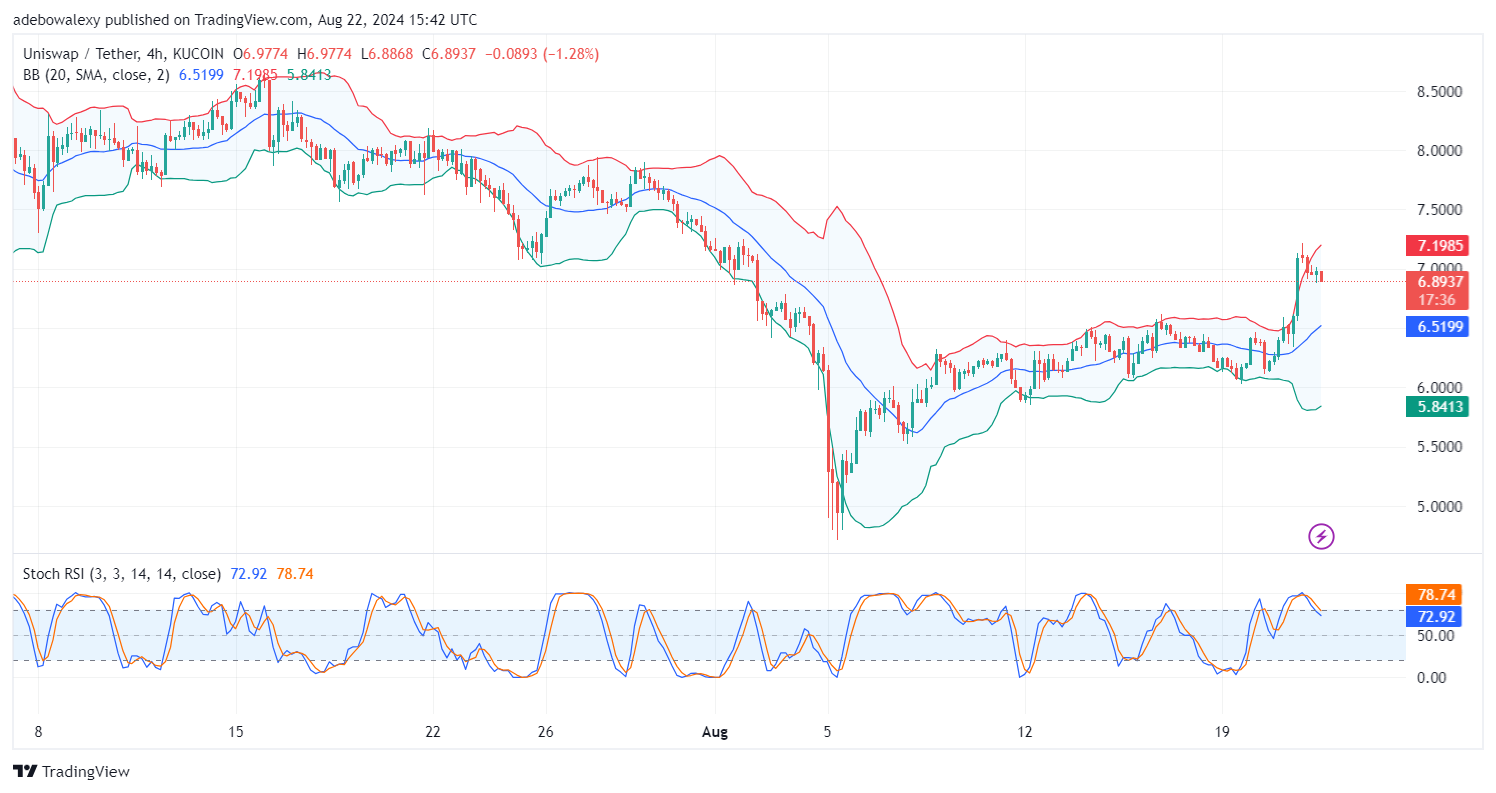
Meanwhile, the Stochastic RSI lines have fallen below the 80 mark of the indicator. From the available signs, traders can anticipate that prices may descend lower, but a resumption of the upside correction is quite possible above the middle limit of the BB indicator.