Bitcoin (BTC) Price Prediction: BTC/USDT Struggles to Break Through the $60,000 Barrier
Estimated Reading Time: 2 minutes
Don’t invest unless you’re prepared to lose all the money you invest. This is a high-risk investment and you are unlikely to be protected if something goes wrong. Take 2 minutes to learn more
Bitcoin (BTC) Price Prediction: August 21
Bitcoin’s price has consistently fallen back after each attempt to break above the $60,000 mark, suggesting that a significant number of bearish traders are putting pressure on this level.
BTC/USDT Long-term Trend: Bullish (Daily Chart)
Key Price Levels:
Resistance: $60,000, $65,000, $70,000
Support: $55,000, $50,000, $45,000
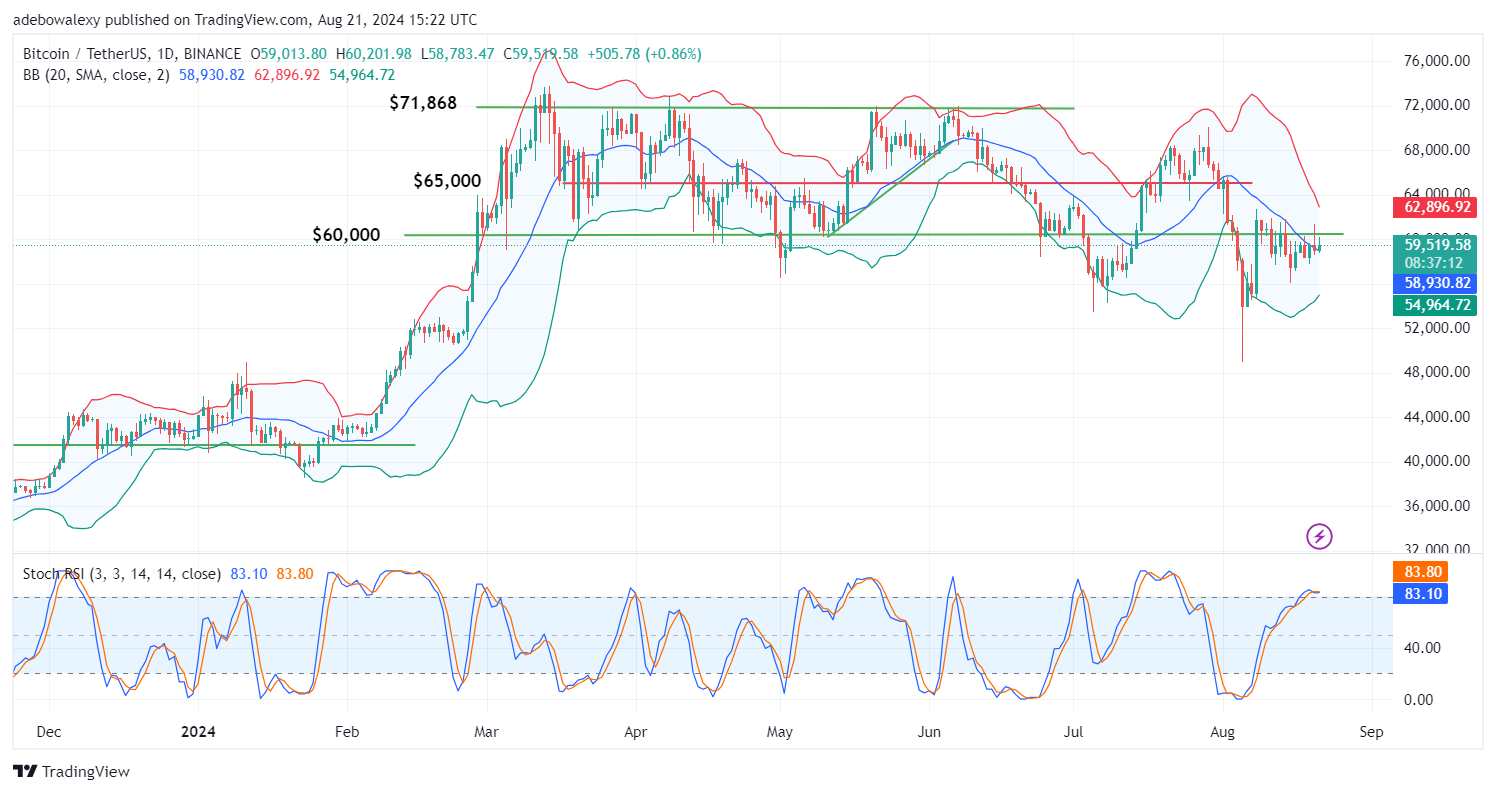
In the current session, some long orders have helped the price remain above the middle line of the Bollinger Bands (BB) indicator. Although there has been some downward pressure, the latest price candle is still green, indicating resilience. The Stochastic Relative Strength Index (Stochastic RSI) lines are hovering around the 80 mark, moving sideways, which shows a balance between buyers and sellers.
Bitcoin (BTC) Price Prediction: BTC/USDT Might Have Found a Support Level
Bitcoin has been struggling to break past the $60,000 mark, with each attempt being met by strong resistance that pushes the price back below this level.
The price candle for the ongoing session is just above the middle line of the BB indicator, and bullish forces seem to be holding strong, as reflected by the green candle. The Stochastic RSI lines are flat at the 80 mark, and the contracting BB lines could be a sign that the bulls might be preparing for another push.
Bitcoin (BTC) Price Prediction: BTC/USDT Faces Ongoing Downward Pressure Despite Upward Focus (4-Hour Chart)
The current session is still aiming upward, but there is clear resistance affecting price movement. Even so, the latest price candle shows Bitcoin trading above the middle line of the BB indicator.
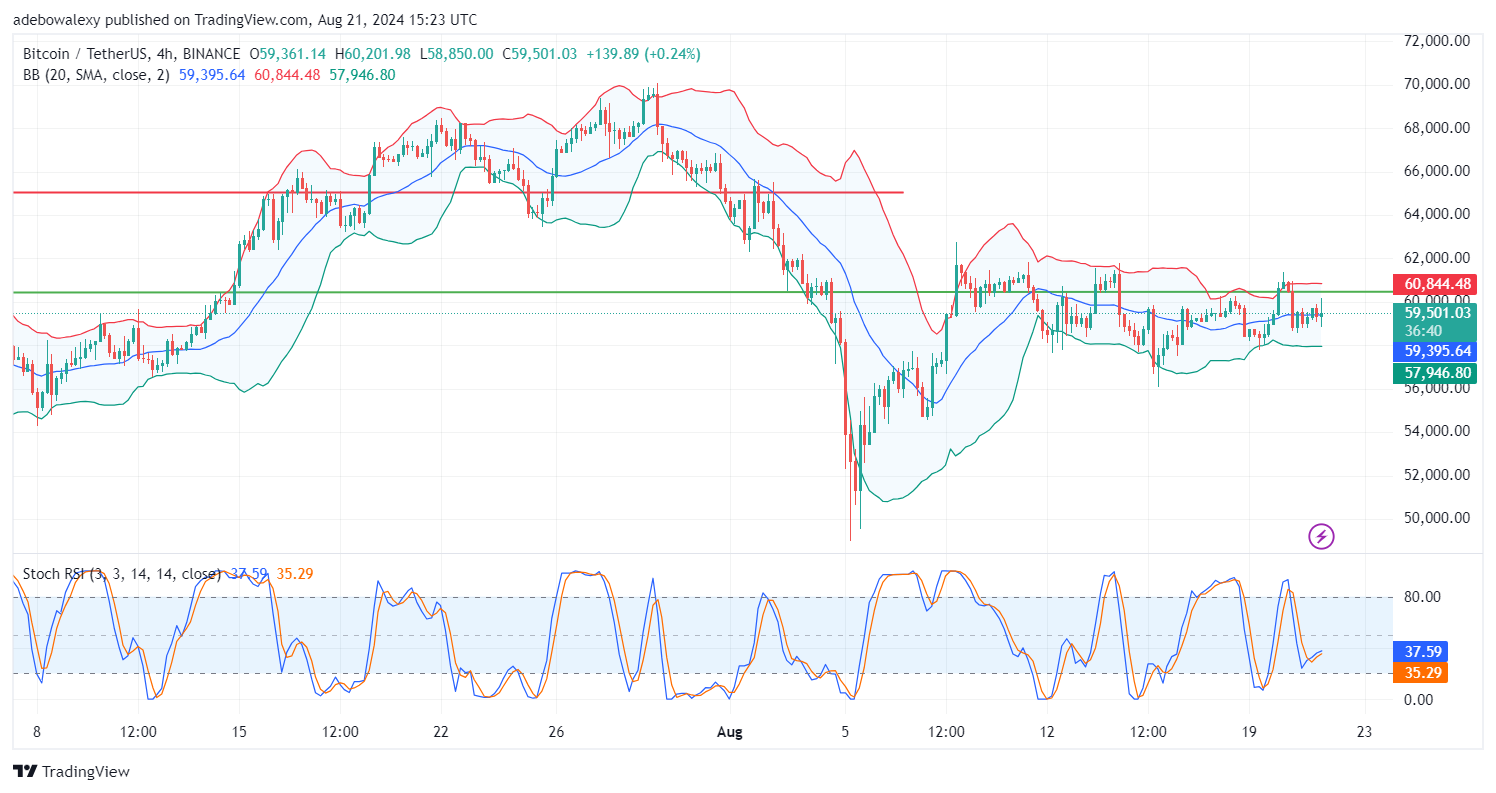
The Stochastic RSI is trending upward but with a slight deflection, indicating some market tension. If buyers can maintain support at the middle line of the BB, it could signal stronger bullish momentum and possibly push the price toward the $62,000 level.