Litecoin (LTC) Price Prediction: LTC/USDT Extends Upside Correction With Minimal Gains
Estimated Reading Time: 3 minutes
Don’t invest unless you’re prepared to lose all the money you invest. This is a high-risk investment and you are unlikely to be protected if something goes wrong. Take 2 minutes to learn more

Litecoin (LTC) Price Prediction: August 20
The Litecoin market has maintained an upward trajectory after rebounding off the $52.00 price level. However, it’s important to note that this upward movement has been characterized by minimal gains. Nevertheless, there are indications that the market may continue along this path.
LTC/USDT Long-term Trend: Bullish (Daily Chart)
Key Price Levels:
Resistance Levels: $70, $80, $90 Support Levels: $60, $50, $40
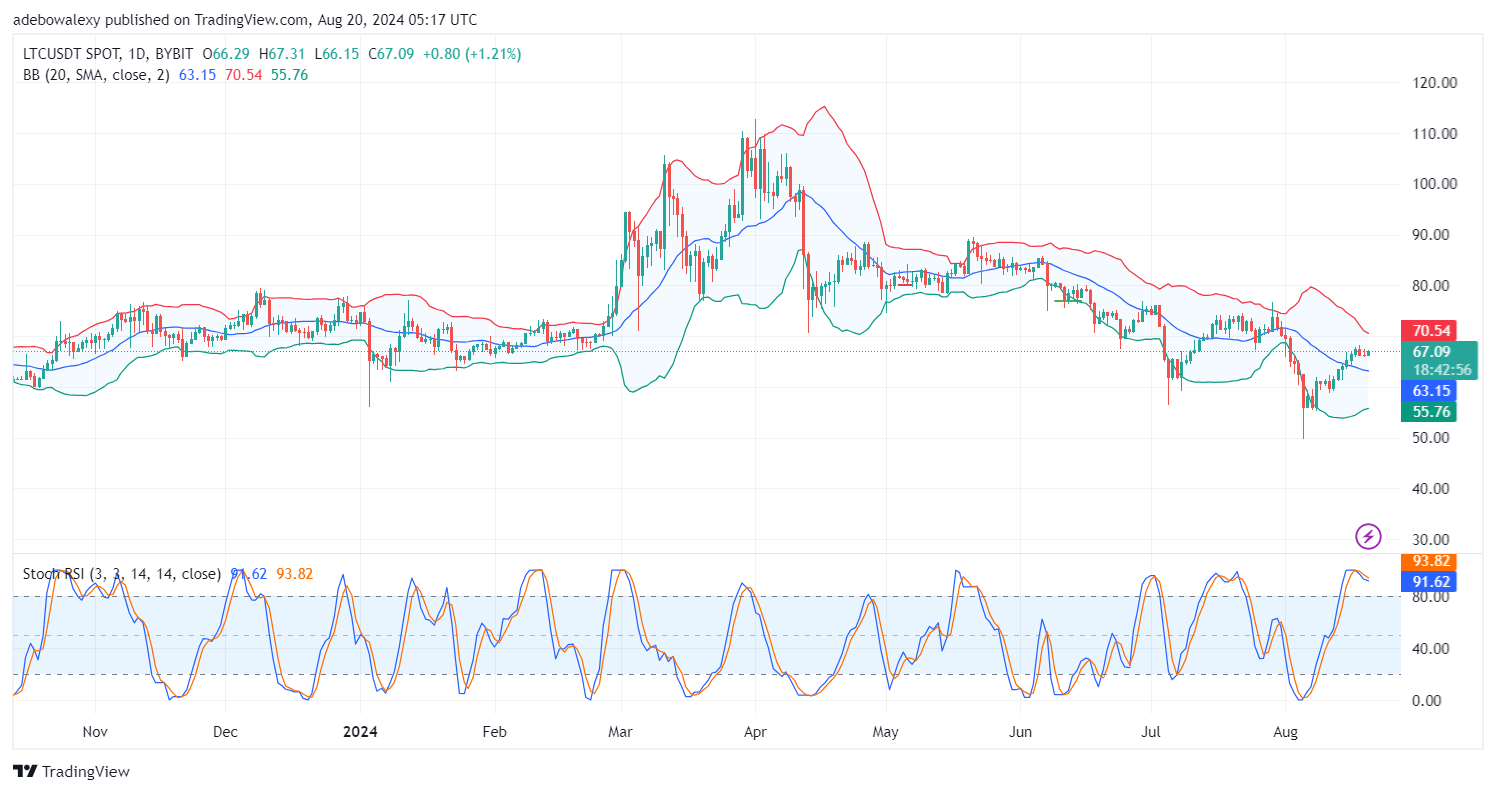
Price action has risen past the middle limit of the Bollinger Bands (BB) indicator. However, the Bollinger Bands on the daily chart display a moderate width. The current session shows a green price candle above the middle band of the BB indicator. Additionally, the Stochastic Relative Strength Index (SRSI) lines are still in the overbought region, attempting to avert a downward trajectory.
Litecoin Price Prediction: LTC/USDT Appears Determined to Rise Further Upward
The Litecoin market has impressively risen past the middle limit of the BB indicator. Moreover, the width of the BB indicator suggests that there is room for volatility to enter the market, which could help price action move more quickly through higher price levels.
The behavior of the SRSI indicator lines in the overbought region suggests that an upside crossover may occur, potentially propelling prices through more elevated levels.
Litecoin Price Prediction: LTC/USDT Faces Continued Resistance (4-Hour Chart)
The previous session in the LTC/USDT market recorded gains that tested the middle limit of the Bollinger Bands (BB) indicator. Meanwhile, the last price candle on the chart appeared green and above the middle limit of the BB indicator. Upon closer observation, one can see that the BB indicator has narrowed, yet price action continues its upward progress. Additionally, the SRSI has an upward trajectory in the oversold region.
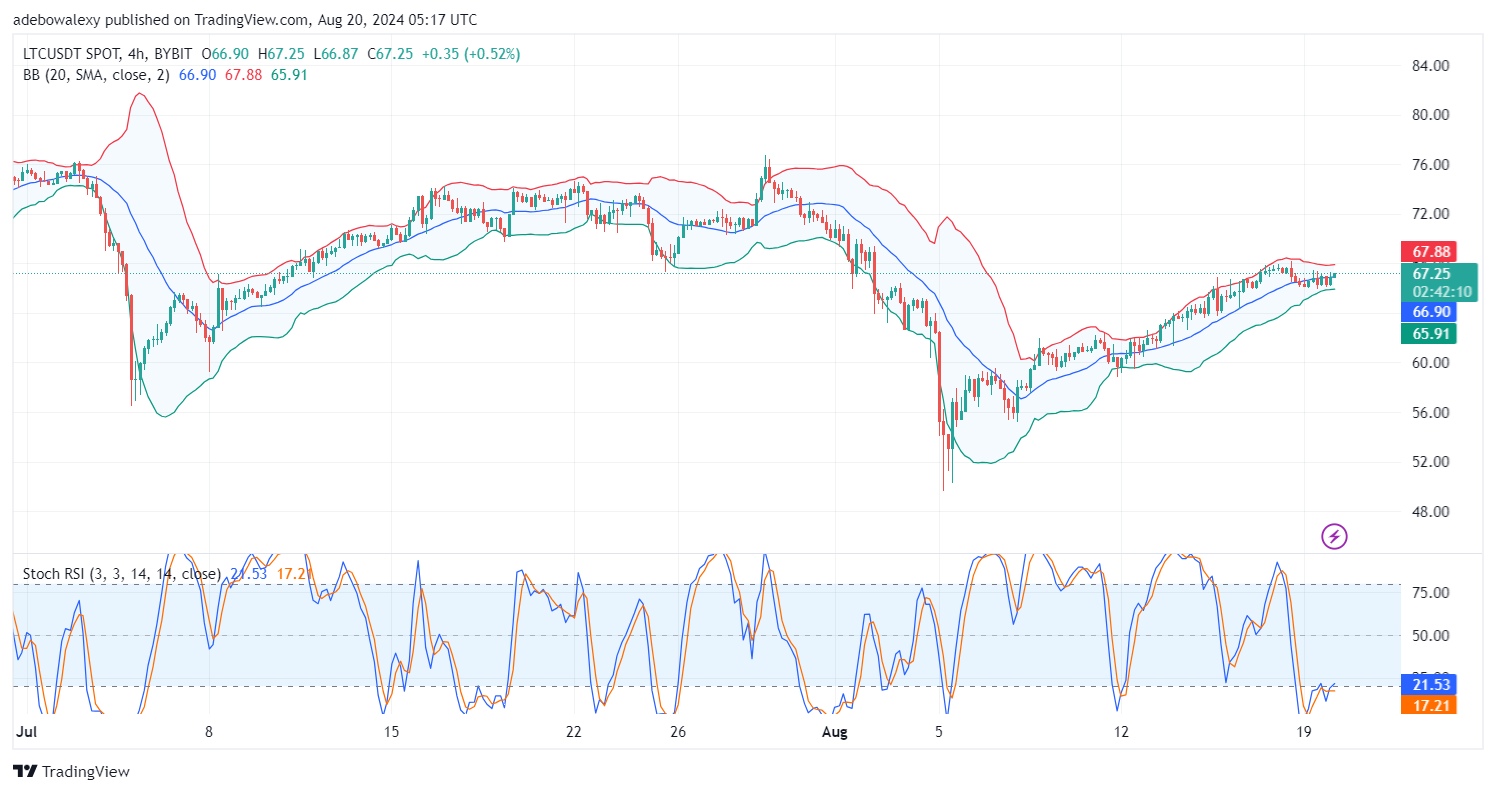
The market is adhering to an upward path, which has been evident since the market dipped below $52 as mentioned earlier. Furthermore, the market seems determined to continue this steady rise towards higher price levels. The BB indicator is contracting further, which hints that price action may see a one-sided but significant move. With the current session now above the middle limit of the BB indicator, it appears that bulls are better positioned to benefit from the impending one-sided price move towards the $70 mark.