Dogecoin (DOGE) Price Prediction: DOGE/USDT Retreats Below the 0.1000 Threshold
Estimated Reading Time: 3 minutes
Don’t invest unless you’re prepared to lose all the money you invest. This is a high-risk investment and you are unlikely to be protected if something goes wrong. Take 2 minutes to learn more

Dogecoin (DOGE) Price Prediction: August 19
Although Dogecoin briefly rose back above the $0.1000 threshold, the coin has failed to sustain its upward movement. Instead, price action has retreated below the mentioned price level. Nevertheless, technical indicators suggest that the market may experience a significant price movement.
DOGE/USDT Long-term Trend: Bullish (Daily Chart)
Key Price Levels:
Resistance Levels: $0.1000, $0.1500, $0.2000
Support Levels: $0.09500, $0.09000, $0.08500
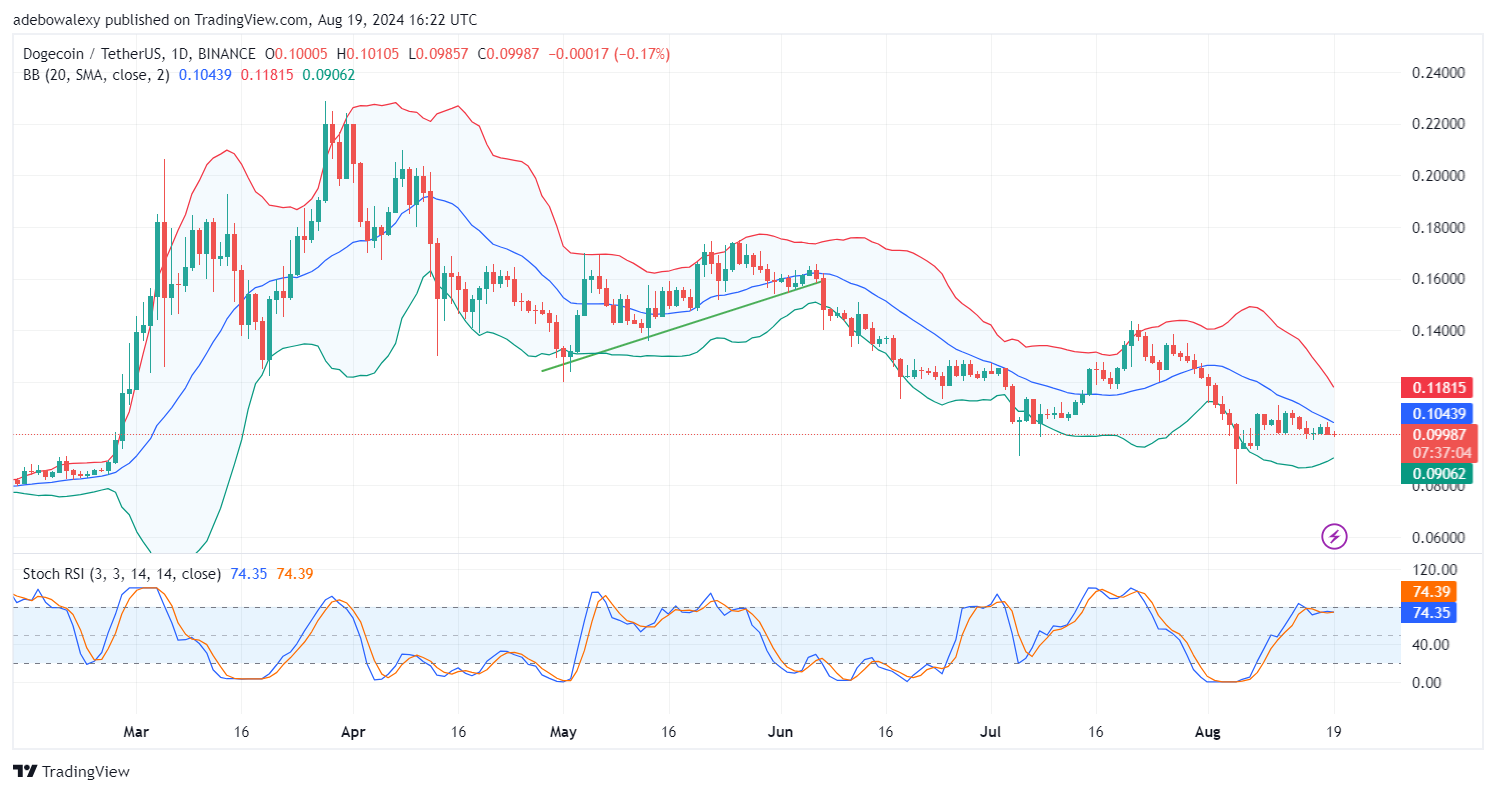
Trading activity in the Dogecoin daily market occurs below the middle limit of the Bollinger Bands (BB) indicator. The ongoing session has turned bearish, as indicated by the color of the corresponding price candle. However, its size suggests that price forces are in a stiff contest. Meanwhile, the Stochastic Relative Strength Index (SRSI) lines are trending sideways above the 70 level. Also, the upper and lower limits of the BB indicator seem to have started contracting.
Dogecoin Price Prediction: DOGE/USDT May Experience a One-Sided Price Move
Recent price movement in the Dogecoin market shows significant consolidation. The middle limit of the BB indicator is approaching price action, and as a result, the market’s last price candle seems to be descending.
However, the contracting upper and lower bands of the BB indicator suggest that downward forces may gain significant traction since price action remains below the middle limit of the BB indicator. Additionally, the SRSI indicator lines move sideways without indicating a specific direction, suggesting that upside forces aren’t likely to win the struggle.
Dogecoin Price Prediction: DOGE/USDT Continues to Face Stiff Contention (4-Hour Chart)
On the Dogecoin 4-hour price chart, price activity over the past six sessions has fallen below the middle limit of the BB indicator. Likewise, the BB indicator itself has contracted significantly.
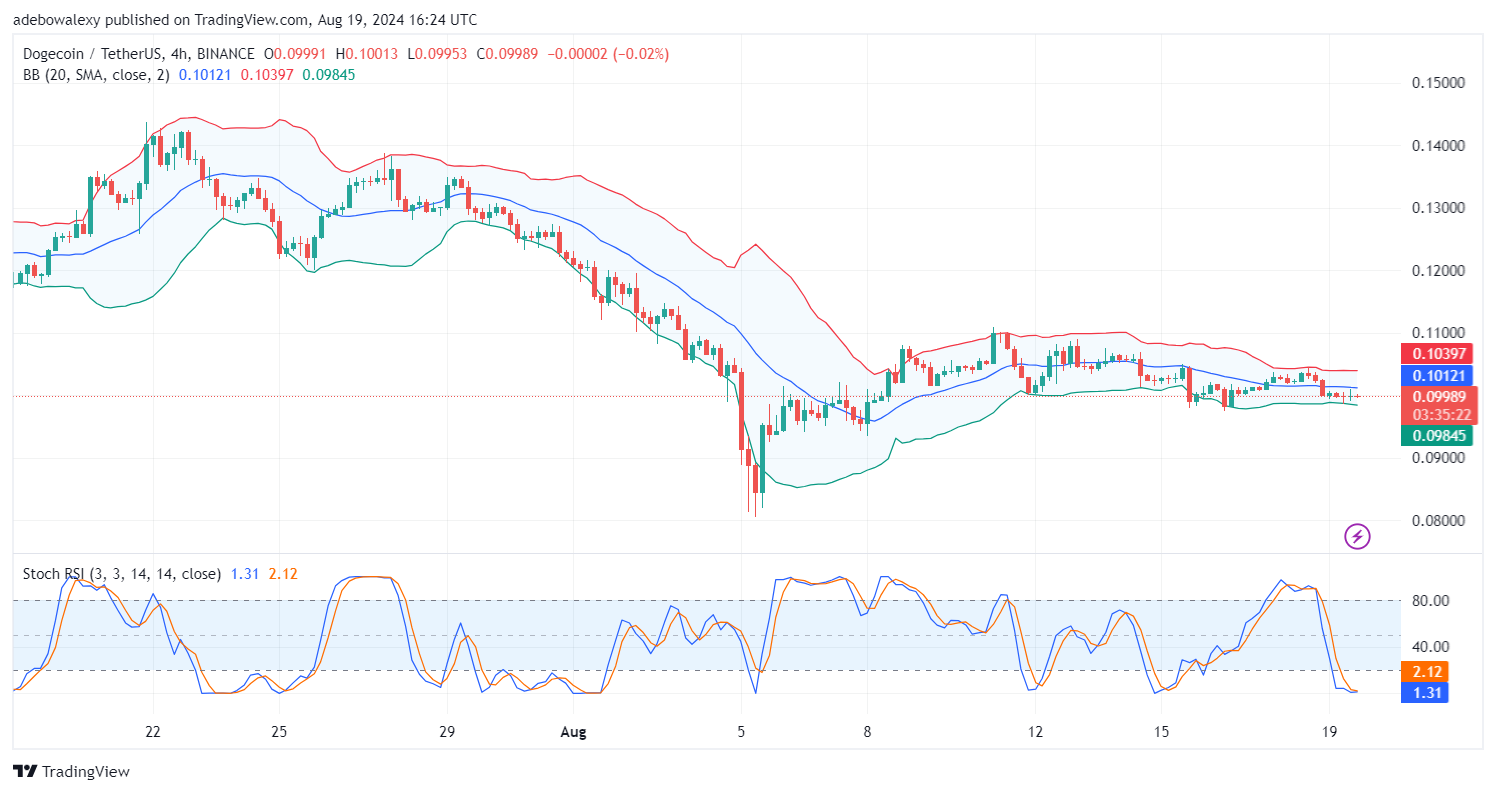
Meanwhile, the SRSI indicator lines have fallen deep into the oversold region and have merged with a sideways trajectory at the peak of the oversold area. Technically, this suggests that bears are more likely to drive the anticipated price move. Consequently, the market may test the support at the $0.09000 mark shortly.

