POL (ex-MATIC) Price Prediction: POL/USDT Trades Below Four-Month Support
Estimated Reading Time: 3 minutes
Don’t invest unless you’re prepared to lose all the money you invest. This is a high-risk investment and you are unlikely to be protected if something goes wrong. Take 2 minutes to learn more

POL (ex-MATIC) Price Prediction (March 1)
Despite recent bearish pressure in the broader crypto market, the POL (ex-MATIC) token has experienced its share of the downturn. This has forced price action below a long-standing support level. However, the market has recovered some ground, though it remains below the highlighted support.
POL/USDT Long-Term Trend: Bearish (Daily Chart)
Key Price Levels:
Resistance: $0.2900, $0.3500, $0.4000
Support: $0.2500, $0.2000, $0.1500
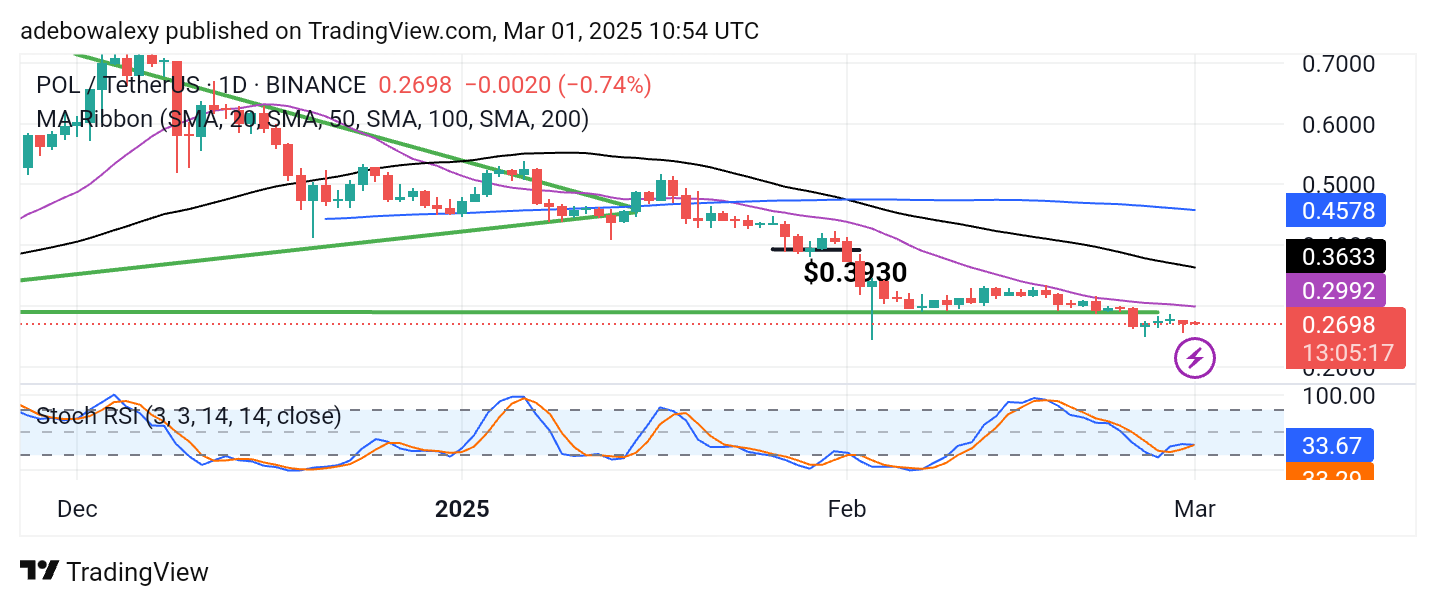
The most recent price candles in the POL (ex-MATIC) market are red, indicating continued bearish sentiment. Additionally, price action remains below all the Moving Average (MA) lines. As a result, the last two daily candles have shown minimal downward retracement during the ongoing and previous sessions. Meanwhile, the Stochastic Relative Strength Index (RSI) lines are converging for a potential crossover while maintaining an upward trajectory.
POL (ex-MATIC) Price Prediction: POL/USDT Attempts to Maintain an Upward Path
Price activity in the POL (ex-MATIC) market has been under sustained bearish pressure, as seen in the positioning of recent daily price candles. While price action remains below the MA lines, the previous and ongoing sessions have shown only slight bearish progress. This suggests that bears still exert some influence on price movements.
Similarly, the Stochastic RSI lines remain in bearish territory, having converged for a crossover below the 50 mark. While there are indications of potential recovery, the market appears more likely to continue its downward trend unless significant fundamental developments alter the trajectory.
POL (ex-MATIC) Price Prediction: POL/USDT Hovers in Search of Support (4-Hour Chart)
The POL (ex-MATIC) market has shown signs of recovery over recent trading sessions, with price action hugging the 20-day MA line. Recent price candles indicate a smooth rebound off this level. Likewise, the Stochastic RSI is mirroring price activity, with its terminal end smoothly turning downward after a crossover above the 60 threshold.
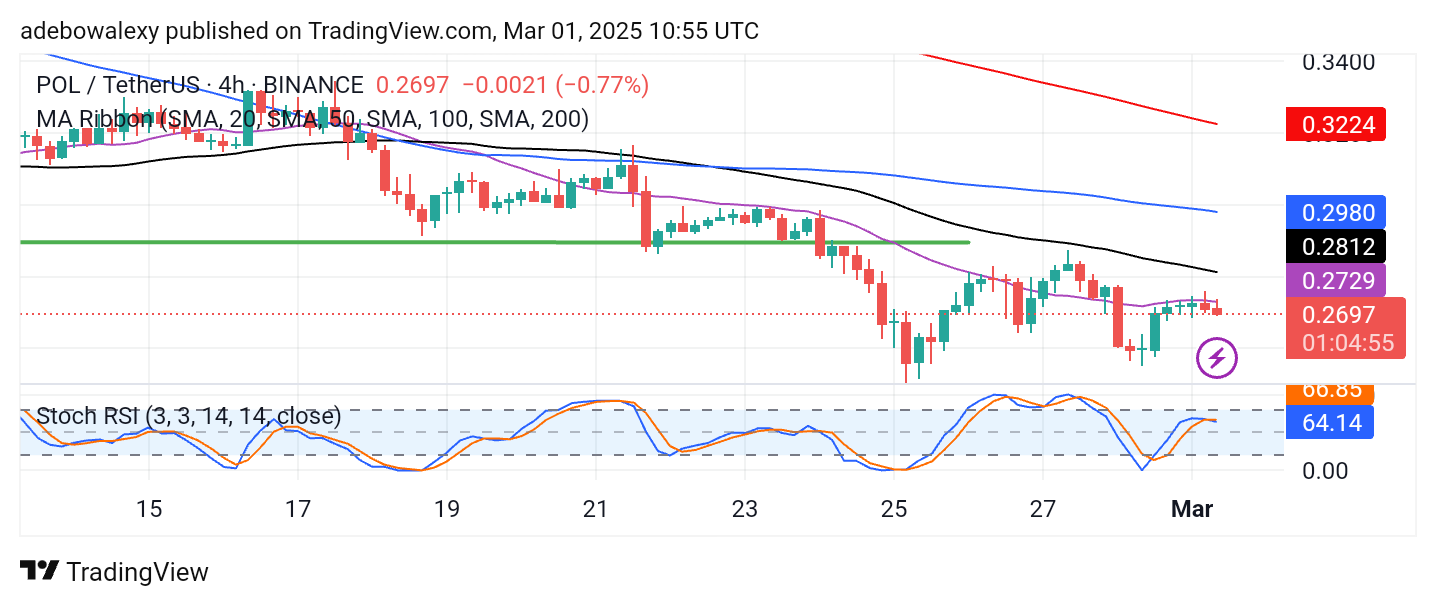
Technically, the short-term outlook remains bearish. As a result, traders may either choose to stay on the sidelines or adopt a bearish stance. However, the recent price candle suggests that downward momentum is losing strength, indicating a possible upward rebound—potentially from the $0.2500 price level.