Polkadot (DOT/USDT) on a Short-term Correction: What’s Next?
Estimated Reading Time: 3 minutes
Don’t invest unless you’re prepared to lose all the money you invest. This is a high-risk investment and you are unlikely to be protected if something goes wrong. Take 2 minutes to learn more
The market outlook of Polkadot against Tether today indicates a cautious upside movement, as the pair, seeing a gain in the previous session, is now correcting to the south. Recently, the price actions suggest a potential pullback after facing a stronger resistance at $4.200, indicating the market may be building a base for strong upside movement.
As it stands, the Guppy Multiple Moving Averages (GMMA) still indicates a positive look, but the Stochastic RSI suggests bullish momentum is waning as the lines point to the south.
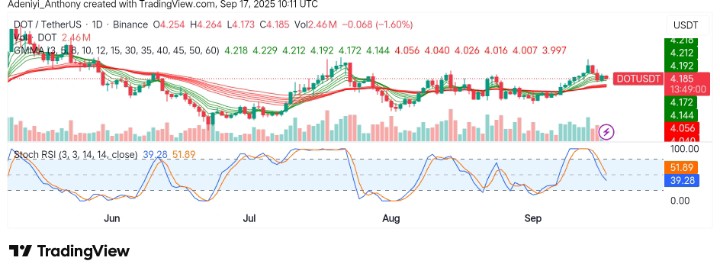
Currently, Polkadot trades at $4.185 with over 2.4 million traded volumes for the day.
Technical Indicator
Major Resistance Levels: $4.260, $4.40, and $5.00
Major Support Levels: $4.060, $3.90, and $3.500
Polkadot Technical Analysis
On the daily timeframe, Polkadot against Tether appears to be trading with moderate volatility; the series of lower highs during the past few days suggests the pair is in a possible consolidation phase and preparing for a strong upside. Additionally, the set of EMAs are beginning to diverge further bullishly, hinting that DOT might record an increasing bullish momentum soon.
However, the Stochastic RSI, on the other hand, signals potential short-term downside as the lines extend into the 20-mark level, signaling that the pair is correcting for a strong breakout in the near term.
To this end, if the pair fails to break above the immediate resistance at $4.260 with increasing volume, a move towards $4.060 might provide a better buying opportunity.
Today’s Polkadot Price News
Polkadot this week has really extended the move towards its lowest low on the weekly timeframe. However, the pair needs to move into the $8.50 zone to form an ABC structure. Additionally, the price action on the shorter chart appears to be testing recent support, but a break above the July swing high will uncover a new layer, as a break below $4.00 may change the whole scenario.
DOT/USDT Analysis: What to Expect
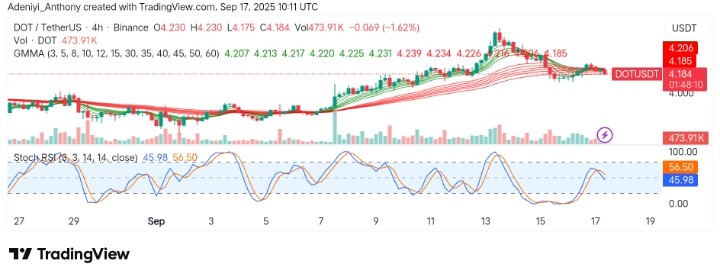
On the 4H chart, DOT/USDT is currently facing a slight dip after a face-off with the $4.23 resistance, pulling back as the set of EMAs remains entangled. The momentum oscillator indicates that sell pressure is dragging the price down as the lines bend to the south around the 50-mark level.
At the moment, DOT/USDT shows no sign of a breakout to the upside, and a prolonged decrease in volume may lead to further bearish actions before a move to the north in the coming sessions.
You can purchase crypto coins here. Buy Crypto