Tamadoge (TAMA/USD): Aiming to Overcome the Decending Resistance Trendline
Estimated Reading Time: 3 minutes
Don’t invest unless you’re prepared to lose all the money you invest. This is a high-risk investment and you are unlikely to be protected if something goes wrong. Take 2 minutes to learn more
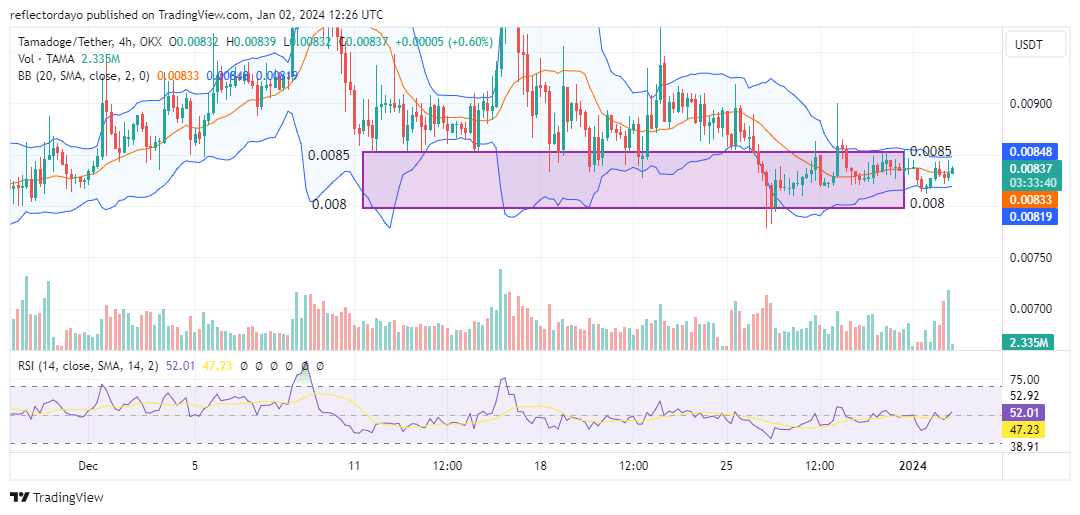
The recent market sentiment for Tamadoge indicates descending peaks, yet the support level remains largely unchanged. While this may underscore the increasing strength of bearish sentiment in the market, it also underscores the steadfast resilience of the bulls at the crucial support zone between $0.0085 and $0.008. Recent market developments suggest a potential bullish recovery, particularly following the market’s test of the $0.008 support level.
Key Levels
- Resistance: $0.013, $0.014, and $0.015.
- Support: $0.0075, $0.0073, and $0.007.
TAMAUSD Price Analysis: The Indicators’ Point of View
After reaching the $0.008 price level, the market reversed course, initiating a bullish recovery, as evidenced by the establishment of a higher support level at $0.00817. In the Tamadoge market, there is a notable recurrence of candlesticks with prominent upper shadows relative to their lower counterparts. This pattern suggests active participation from bulls defending lower price levels, indicative of potential buying interest. Furthermore, this recurrent testing of resistance levels suggests ongoing market evaluation. Should bulls successfully breach these resistance levels, it may precipitate an upward breakout.
Within the framework of a consolidating market, the consistent presence of candlesticks with upper shadows could signify a potential reversal or a shift in market momentum. Should bulls sustain their upward pressure and surpass the consolidation range, it may herald a transition from a sideways trend to a bullish trajectory.
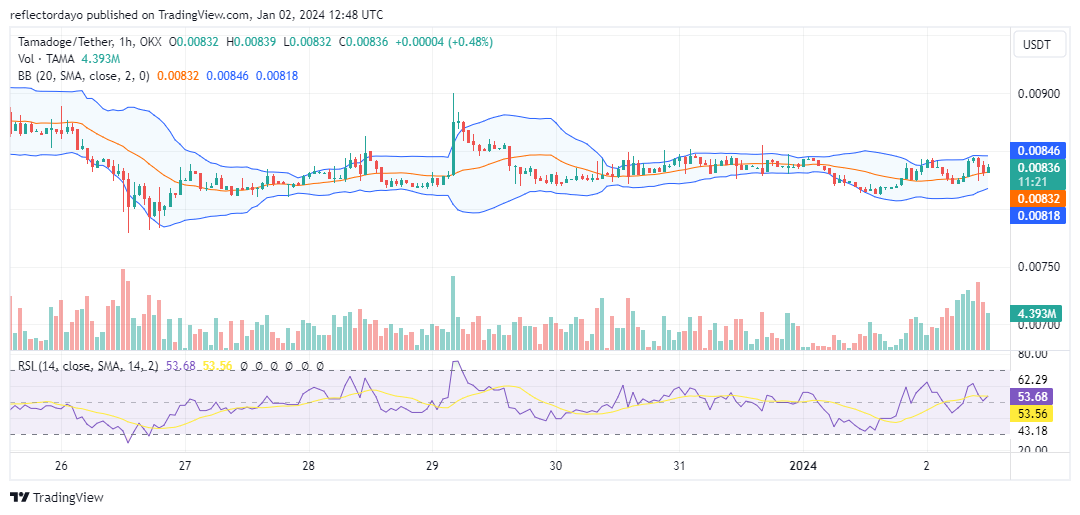
Tamadoge Short-Term Outlook: 1-Hour Chart
As the market currently oscillates within the price range of $0.008 to $0.0085, there has been a discernible build-up of bullish momentum. Bulls have been instrumental in establishing a support level proximate to the $0.0085 price mark, which has subsequently transformed into the new resistance level. The bullish recovery appears to be gaining traction, with significant attention directed towards the $0.0085 price level. A breach of this threshold would likely signal the solidification of the bullish trend.
Play Tamadoge Arena Challenge mode against other players to wager, challenge, and win big.
Bet, challenge, and win big against other players in Tamadoge Arena Challenge mode 🎉
New players start with 20 FREE credits!
Download on iOS & Android 👇
📱 Android: https://t.co/dB4zatlCdy
📱 iOS: https://t.co/PiDAjnDmaZ pic.twitter.com/Slr3lpevjP— TAMADOGE (@Tamadogecoin) January 2, 2024
Do you want a coin that will be 100 times more valuable in the next few months? That is Tamadoge. Buy TAMA today!