Tamadoge Bulls Regain Momentum: A Bullish Resurgence on the Horizon
Estimated Reading Time: 3 minutes
Don’t invest unless you’re prepared to lose all the money you invest. This is a high-risk investment and you are unlikely to be protected if something goes wrong. Take 2 minutes to learn more
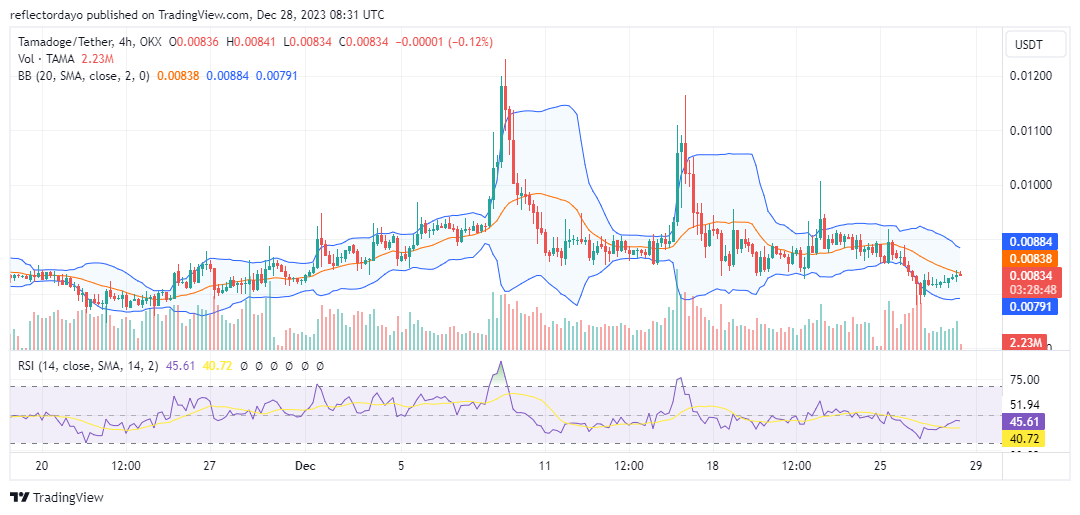
Tamadoge (TAMA/USD) has recently navigated a challenging market landscape marked by bearish undertones. Notably, the bull market faced hurdles, evident from its inability to sustain momentum, characterized by a series of approximately three lower highs—a bearish pattern that often raises eyebrows among seasoned analysts. This downtrend culminated in the asset’s value nearing the $0.0008 mark.
However, the market’s narrative took a positive turn around this pivotal level. The Tamadoge bulls have emerged with renewed vigor, effectively halting the bearish descent and hinting at a possible market reversal. Such resilience in the face of adversity suggests underlying strength and confidence among bullish investors.
Key Levels
- Resistance: $0.013, $0.014, and $0.015.
- Support: $0.0075, $0.0073, and $0.007.
TAMAUSD Price Analysis: The Indicators’ Point of View
From a broader perspective, Tamadoge‘s price trajectory has been marked by consistent, nuanced growth—a testament to its sustainable recovery. Unlike volatile market movements, which can often be short-lived, this steady climb suggests a robust foundation and growing investor confidence. Such positive market dynamics are likely to draw heightened interest and participation from the trading community.
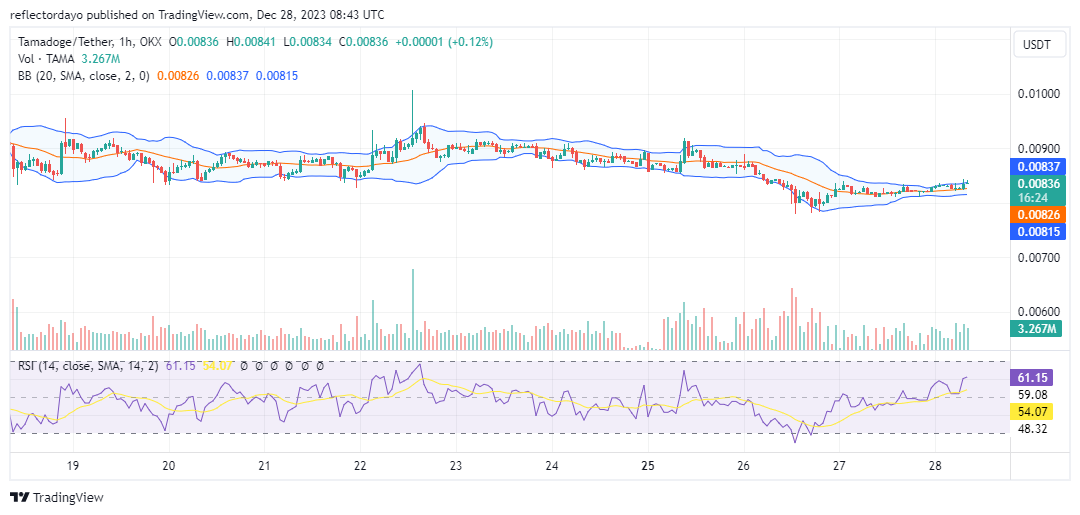
Tamadoge Short-Term Outlook: 1-Hour Chart
The 1-hour chart analysis of Tamadoge reveals intriguing market dynamics through its Bollinger Bands and Relative Strength Index (RSI). The Bollinger Bands’ tight configuration suggests market equilibrium and reduced volatility, akin to a coiled spring poised for a significant price shift. Meanwhile, the RSI hovers around the 60 mark, indicating robust bullish momentum with active buyer participation. This, combined with the Bollinger Bands’ tension, suggests potential for a notable upward movement. Given these indicators, there’s a bullish sentiment in Tamadoge, with potential for a breakout towards the $0.0009 resistance level in the short term, warranting vigilant observation by traders and investors.
There’s not much longer to climb to the top of the weekly leaderboards!
The weekly leaderboards are closing in – it’s your last chance to climb to the top! 🎮
Play your favorite Tamadoge game, secure your spot, and let the games begin!Find all of our games with the links below 👇
📱 Android: https://t.co/YULpfGci8o
📱 iOS: https://t.co/3BEB2FjtkH pic.twitter.com/lmq793HZlm— TAMADOGE (@Tamadogecoin) December 27, 2023
Do you want a coin that will be 100 times more valuable in the next few months? That is Tamadoge. Buy TAMA today!