TRON (TRX/USD) Resumes Upward Momentum, Breaking Out After a Two-Month Pause at $0.105000
Estimated Reading Time: 3 minutes
Don’t invest unless you’re prepared to lose all the money you invest. This is a high-risk investment and you are unlikely to be protected if something goes wrong. Take 2 minutes to learn more
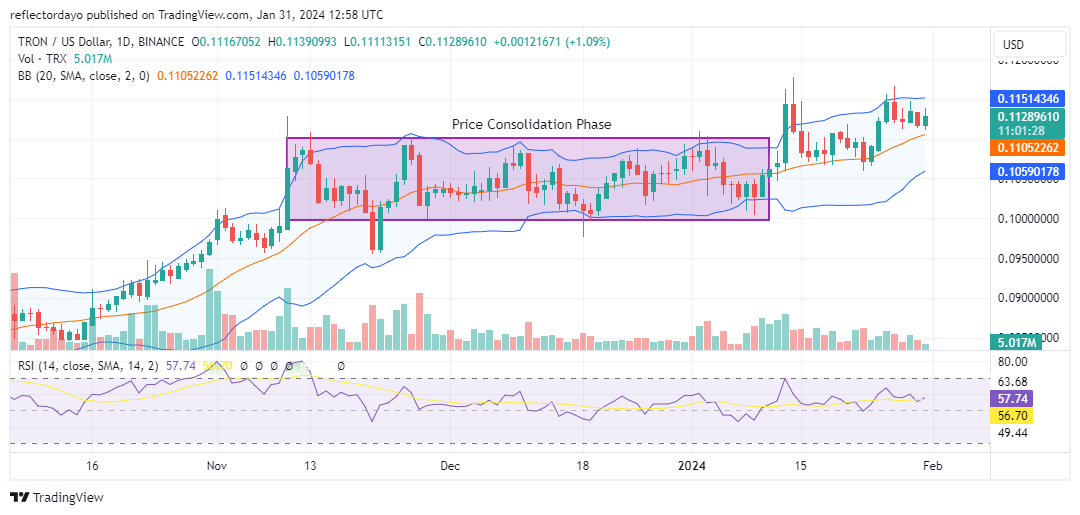
In 2023, the TRON market experienced a favorable period for bullish trends, characterized by sustained upward movement for the majority of the year. Despite challenges faced by other markets, TRON maintained its bullish stance. However, in November of the same year, a notable consolidation phase emerged, primarily centered around the $0.10500 price level. This consolidation persisted for approximately two months, concluding with the breakout observed on January 13 as the price broke above the $0.1100 price level. In today’s trading session, the bullish target is the $0.11500 price level.
TRON Market Data
- TRX/USD Price Now: $0.1126
- TRX/USD Market Cap: $ 9.9 Billion
- TRX/USD Circulating Supply: 88,138,623,314 TRX
- TRX/USD Total Supply: 88,138,623,314 TRX
- TRX/USD CoinMarketCap Ranking: #11
Key Levels
- Resistance: $0.1150, $0.1200, and $0.1233.
- Support: $0.1050, $0.1000, and $0.0954.
The TRON Market Crypto Signal: Analyzing the Indicators
The TRON market, as indicated by the Relative Strength Index (RSI), has exhibited pronounced and erratic price swings over an extended period of time. Throughout the majority of the year, these fluctuations encompassed the bearish, bullish, and overbought zones, with minimal instances of crossing into the oversold region. The crypto signal derived from this indicator underscores a prevailing bullish force in the market.
Despite the development of a consolidation phase around November, centered at $0.10500, which led some traders and investors to anticipate the conclusion of the prolonged bullish trend, sentiments remain bullish. This sentiment persisted as the price surpassed the $0.1100 threshold on January 13. Presently, the bull market has established a support level above this $0.1100 mark, indicating a potential inclination towards higher price levels.
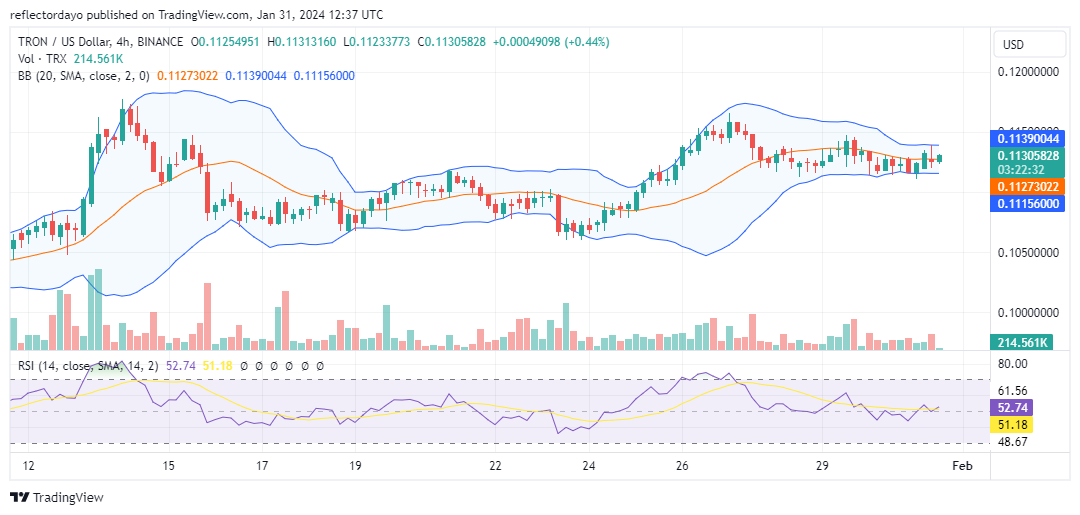
TRX/USD 4-Hour Chart Outlook
Following the successful breach of the $0.1100 resistance level, the market has stabilized around the $0.1127 price level. At this juncture, the price action aligns closely with the 20-day moving average, indicating the establishment of a newfound support level. This development suggests the potential for further upward price advancement.
However, simultaneous consolidation of the price in this range may signal a prospective shift towards a bearish trend. Nevertheless, an examination of the historical performance of this market reveals a lack of substantial strength in the bearish aspect. Therefore, it is more probable that the prevailing bullish trend in the market will persist.