0x (ZRXUSD) Aims at $1.20; Price Has to First Push Past $1.10
Estimated Reading Time: 3 minutes
Don’t invest unless you’re prepared to lose all the money you invest. This is a high-risk investment and you are unlikely to be protected if something goes wrong. Take 2 minutes to learn more
Market Analysis – ZRX Aims at Breaking Past $1.10 to Reach $1.20
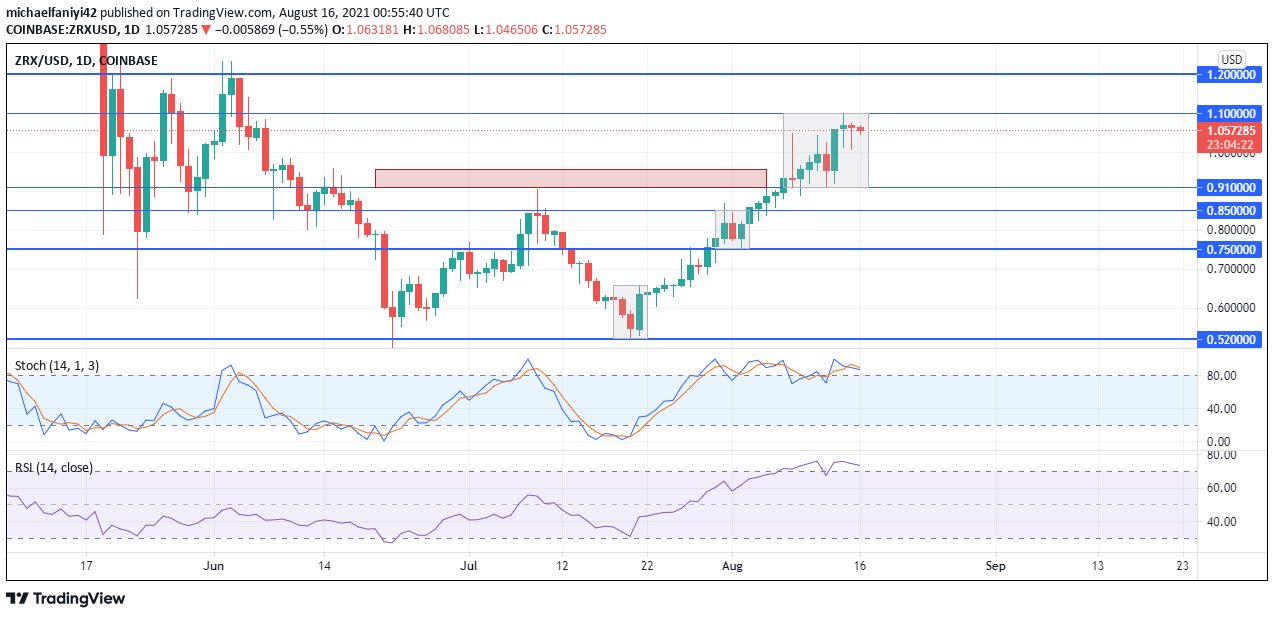
ZRX aims at the $1.20 price level but first has to overcome the $1.10 huddle. The market has been agitating towards higher levels since it commenced its bullish run on the 12th of July 2021. It sprang up using a bullish engulfment candle pattern. This propelled ZRX above the $0.75 resistance. Buyers had to catch their breath at this level with a retest to $0.75 as support before they sprang up further.
ZRX Key Levels
Resistance Levels: $1.10, $1.20
Support Levels: $0.75, $0.91
0x also bull-dozed through to the $0.91 key level. At this point, it is as though the buyers have over-exerted themselves, but the market is determined and still aims to reach further higher. Eventually, the price was rejected at $1.10. With the market currently trading at around $1.05, ZRX is struggling to break down the $1.10 resistance. For the past two days, the price has closed with a doji and a spinning-top candlestick respectively. This shows indecision in the market, with neither bulls nor bears having the upper hand.
The Stochastic Oscillator reveals that since breaking above the $0.75 resistance, the market has moved into the overbought region. Not even the retest back to the same level, nor the past few days of market indecision, could make the coin drop below the overbought region. This shows that the buyers have over-exerted themselves. If they don’t recover soon, they could now leave a loophole for bears to step in to plunge the market.

Market Anticipation
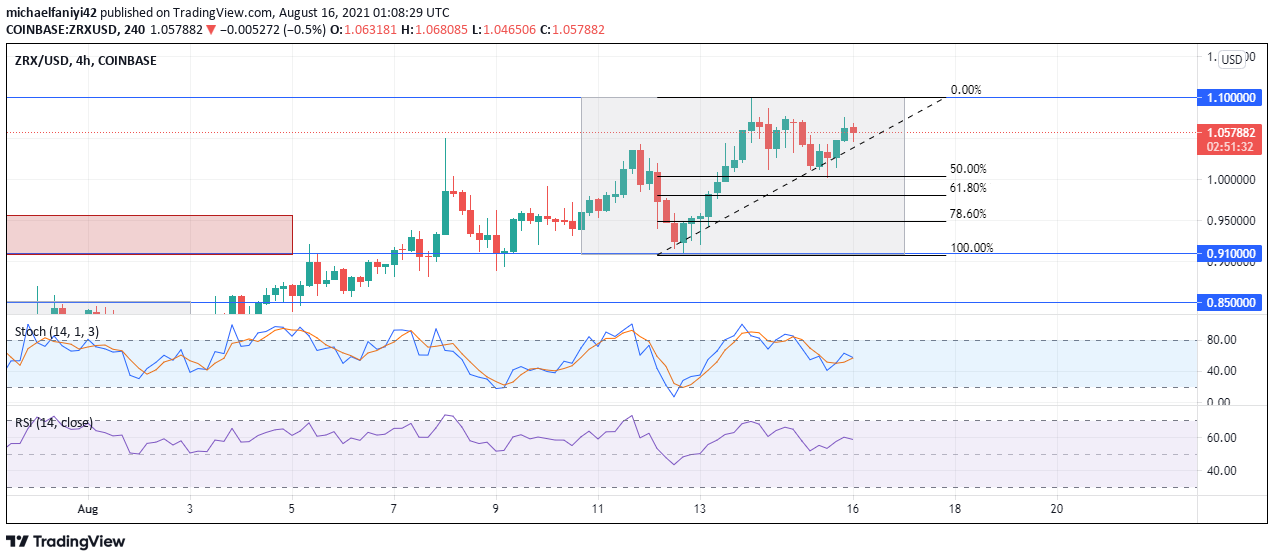
Plotting the Fibonacci ratio on the most recent market structure range formed on the 4-hour chart, we can see that price has retraced to the 50% discount level and has bounced off that level upwards. Price is now in ascendency to test the $1.10 key level again. Still, on the 4-hour chart, the retracement has caused the RSI (Relative Strength Index) signal line to bounce off the middle line. Price, therefore, remains in the buying half and there is optimism that the coin will keep going up, and make it past $1.10.
If the coin finds a weakness to push through $1.10, it will climb to $1.20 with a further aim set at $1.50.
You can purchase crypto coins here: Buy Tokens
Note: Cryptosignal.org is not a financial advisor. Do your research before investing your funds in any financial asset or presented product or event. We are not responsible for your investing results.