Lucky Block Price Prediction: LBLOCK/USD Heads to $0.0021 Resistance; More Buyers Are Expected
Estimated Reading Time: 3 minutes
Don’t invest unless you’re prepared to lose all the money you invest. This is a high-risk investment and you are unlikely to be protected if something goes wrong. Take 2 minutes to learn more
Lucky Block Price Prediction – October 25
The Lucky Block price prediction shows that LBLOCK trades above the moving averages as the market price prepares for a breakout.
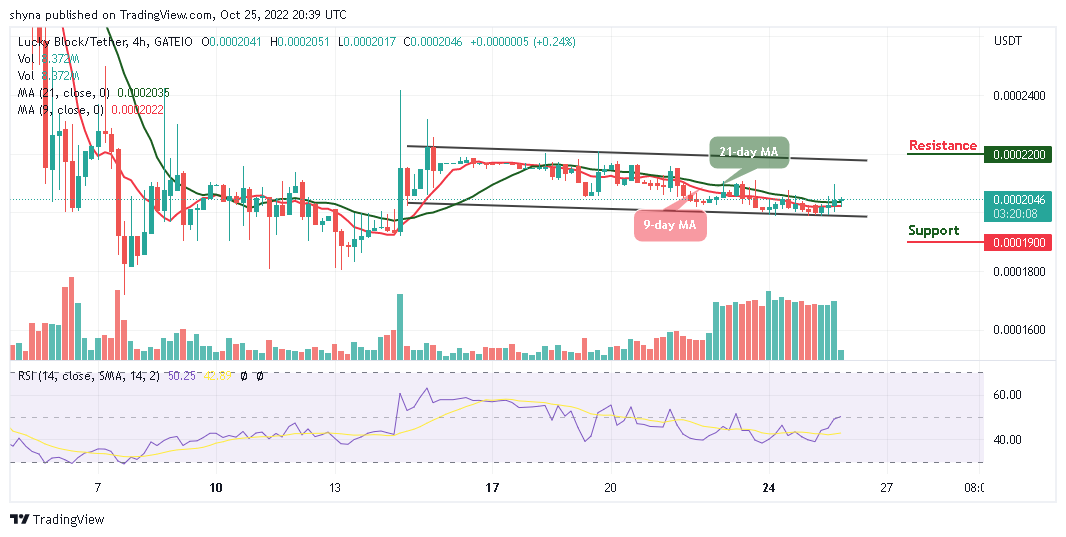
LBLOCK/USD Medium-term Trend: Ranging (4H Chart)
Key Levels:
Resistance levels: $0.00022, $0.00023, $0.00024
Support levels: $0.00019, $0.00018, $0.00017
LBLOCK/USD is at the moment crossing above the 9-day and 21-day moving averages as the coin trades at $0.000204. However, the buyers are pushing the Lucky Block price to the upside. Meanwhile, if the sellers bring the market further lower once again, buyers are expected to buy the dip as the coin prepares for an upward movement.
Lucky Block Price Prediction: LBLOCK Moves Bullishly
The Lucky Block price is currently following the upside as bulls resume back into the market. However, it is likely for the coin to fall slightly if the technical indicator Relative Strength Index (14) crosses below the 50-level, but the LBLOCK would spike to the upside as soon as the technical indicator heads to the upside. Meanwhile, any bearish movement towards the lower boundary of the channel may locate supports at $0.00019, $0.00018, and $0.00017.
However, should the buyers hold the current support of $0.00020 and climb higher; the bulls can expect the potential resistance to be located at $0.00021. Any further bullish movement could be located at resistance levels at $0.00022, $0.00023, and $0.00024.
LBLOCK/USD Medium-term Trend: Ranging (2H Chart)
On the 2-hour chart, the Lucky Block price is currently above the 9-day and 21-day moving averages as the bulls are expected to push the coin above the upper boundary of the channel. Nevertheless, new buyers are expected to come into the market to invest as the coin moves to gain higher levels.
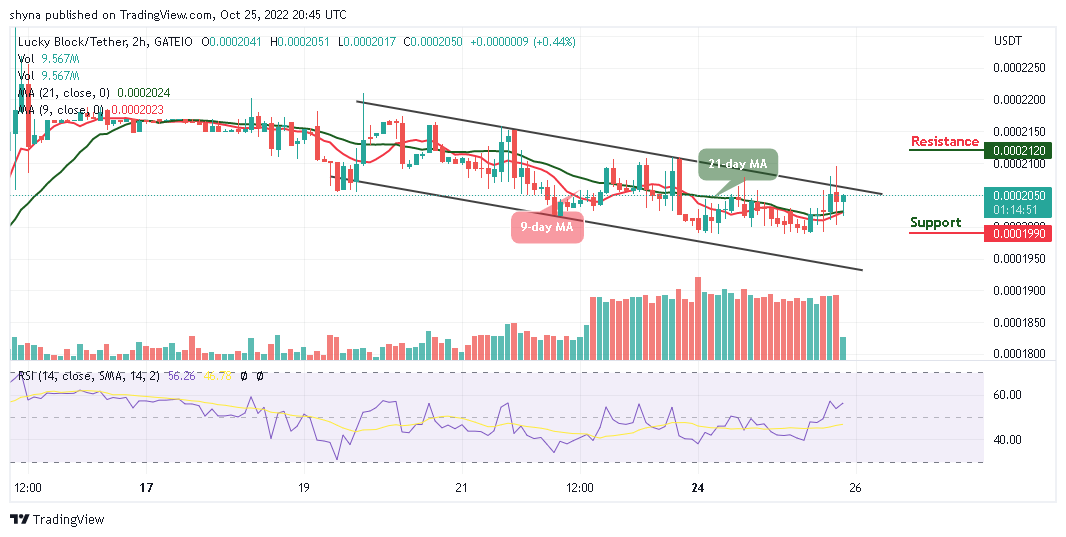
From above, if the buyers push the price above the upper boundary of the channel, any further bullish movement will locate the resistance level at $0.000212 and above. Moreover, should the coin retreats below the 9-day and 21-day moving averages, the nearest support can come at $0.000199 and below, while the Relative Strength Index (14) may cross above the 60-level, suggesting more bullish movements.
You can purchase Lucky Block here. Buy LBLOCK