Lucky Block Price Prediction: LBLOCK/USD Gets Ready for a Spike Above $0.000150
Estimated Reading Time: 3 minutes
Don’t invest unless you’re prepared to lose all the money you invest. This is a high-risk investment and you are unlikely to be protected if something goes wrong. Take 2 minutes to learn more
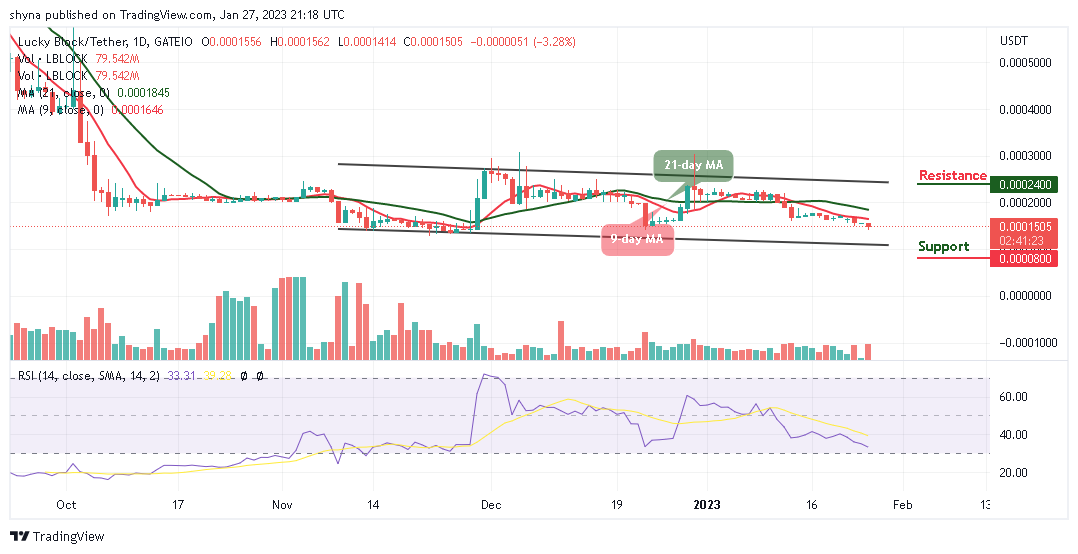
Lucky Block Price Prediction – January 27
The Lucky Block price prediction reveals that LBLOCK is trading around $0.000150 as buyers could regroup to push the market to the upside.
LBLOCK/USD Long-term Trend: Ranging (1D Chart)
Key Levels:
Resistance levels: $0.000240, $0.260, $0.000280
Support levels: $0.000080, $0.000060, $0.000040
LBLOCK/USD buyers have been trying to regroup to push the price above the $0.000150 level. Meanwhile, sellers have pushed it to its lowest support near $0.000140, but the Lucky Block was able to recover shortly afterward. Moreover, this crypto appears to have found a strong landing support where it could take an upward movement.
Lucky Block Price Prediction: LBLOCK/USD Gets Ready to Face the North
The Lucky Block price is preparing for the bullish movement as the buyers regroup to increase the buying pressure. Meanwhile, if the coin begins the bullish movement, it will head toward the upper boundary of the channel where it can hit the resistance levels of $0.000240, $0.000260, and $0.000280. On the downside, if the Lucky Block price drops below the lower boundary of the channel, it could reach the support levels at $0.000080, $0.000060, and $0.000040
LBLOCK/USD Medium-term Trend: Ranging (4H Chart)
LBLOCK/USD is trying to cross above the 9-day and 21-day moving averages as the technical indicator Relative Strength Index (14) moves to cross above the 40-level. However, a possible bearish drop could surface and any further bearish movement below the lower boundary of the channel could bring the coin to the support level of $0.000120 and below.
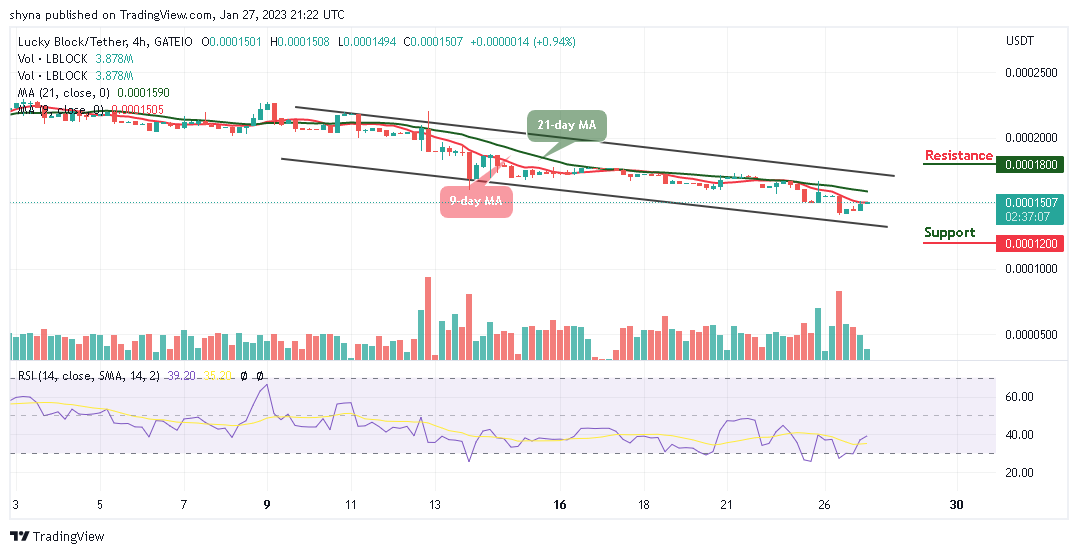
However, if the bulls push the coin higher, the LBLOCK price can cross above the upper boundary of the channel. Once it crosses this barrier, the market price would hit the resistance level of $0.000180 and above. Moreover, the trading volume is coming up slowly and will begin to climb higher if the technical indicator moves to the positive side.
You can purchase Lucky Block here. Buy LBLOCK