Lucky Block Price Prediction: LBLOCK/USD Could Touch $0.000141 Level Before Moving Higher
Estimated Reading Time: 3 minutes
Don’t invest unless you’re prepared to lose all the money you invest. This is a high-risk investment and you are unlikely to be protected if something goes wrong. Take 2 minutes to learn more
Lucky Block Price Prediction – January 27
The Lucky Block price prediction reveals that LBLOCK is exchanging hands $0.000144 as the buying pressure increases in the preparation for the upside.
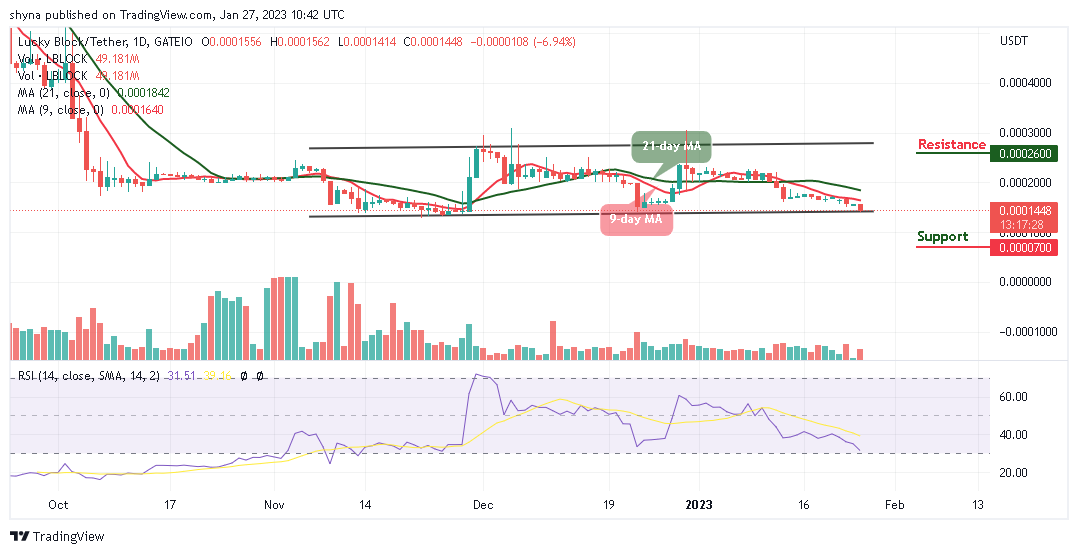
LBLOCK/USD Long-term Trend: Ranging (1D Chart)
Key Levels:
Resistance levels: $0.000260, $0.000280, $0.000300
Support levels: $0.000070, $0.000050, $0.000030
LBLOCK/USD is at the moment trading at $0.000144 while the coin prepares for the bullish movement. Nonetheless, the current trend shows that a bullish movement is likely to come to focus if the coin crosses above the 9-day and 21-day moving averages.
Lucky Block Price Prediction: LBLOCK/USD Prepares for the Upside
According to the daily chart, the Lucky Block price is moving sideways and it will begin to follow the bullish movement once the coin touches the support level of $0.000140. In other words, if the coin delays its bullish movement, it is likely for the bears to increase the selling pressure and this could become severe for the new investors to enter. Meanwhile, any further bearish movement could hit the supports at $0.000070, $0.000050, and $0.000030.
However, the Lucky Block price can begin to move bullishly as soon as the technical indicator Relative Strength Index (14) leaves the downside. Therefore, the potential resistance levels at $0.000260, $0.000280, and $0.000300 will come to play as buyers are expected to come into the market.
LBLOCK/USD Medium-term Trend: Ranging (4H Chart)
Looking at the 4-hour chart, the Lucky Block price is hovering below the 9-day and 21-day moving averages. With the look of things, if the Lucky Block price faces the north and breaks above the moving averages; it could experience an upward trend which may the resistance level at $0.000180 and above.
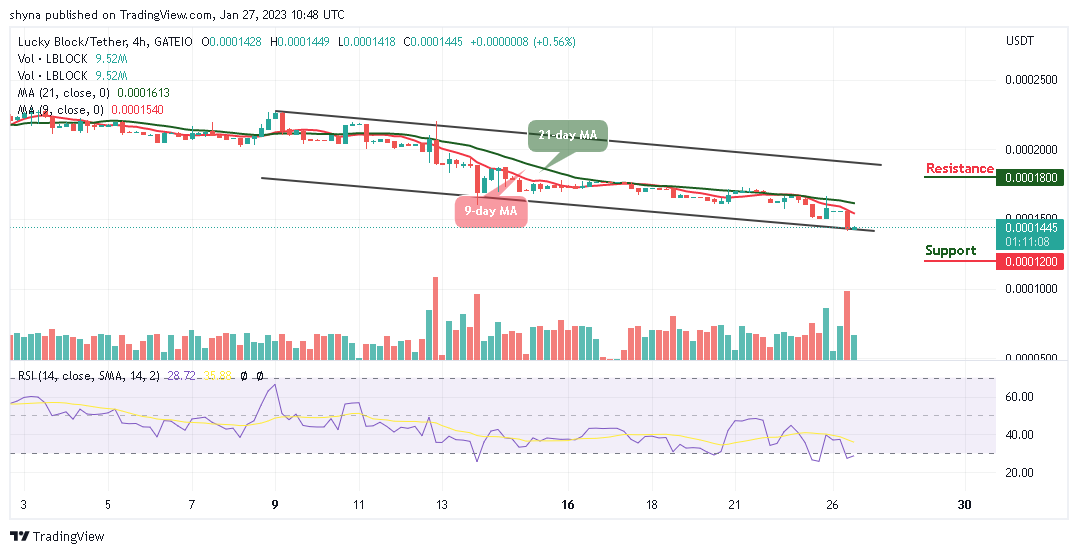
Moreover, if the bulls return to the market, LBLOCK/USD would face the upper boundary of the channel, but it can retreat and crosses below the lower boundary of the channel which could hit the support at $0.000120 and below if the bears increase the pressure. Nonetheless, the technical indicator Relative Strength Index (14) remains within the oversold region, suggesting a bullish signal for the market.
You can purchase Lucky Block here. Buy LBLOCK