$SPONGE (SPONGE/USD) Surges Ahead but Faces Key Resistance at $0.00004
Estimated Reading Time: 3 minutes
Don’t invest unless you’re prepared to lose all the money you invest. This is a high-risk investment and you are unlikely to be protected if something goes wrong. Take 2 minutes to learn more

The ongoing tug-of-war between SPONGE/USD buyers and sellers persists, with the bulls showing signs of gaining an advantage as observed in the previous analysis. Today’s market outlook reveals renewed bullish momentum, with prices rebounding and approaching the critical $0.00004 level. Despite the bears asserting their presence at this resistance level, the bulls are demonstrating resilience, increasing the likelihood of a potential breakout.
Key Market Dynamics:
- Resistance Levels: $0.00005, $0.000055, $0.000060
- Support Levels: $0.000020, $0.0000195, $0.000019
$SPONGE (SPONGE/USD) Technical Outlook
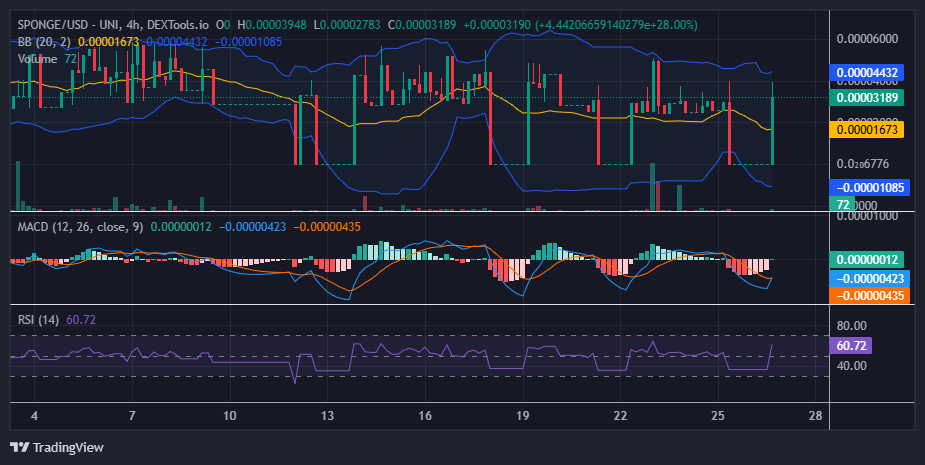
The recent standoff between SPONGE/USD buyers and sellers at the $0.00005 price level, which resulted in a breakdown, appears to have strengthened bearish momentum, driving prices further downward. However, buyers have established strong support at the $0.0000006 level, while sellers maintain resistance at $0.0000004, contributing to a stabilizing market. This is further supported by the convergence of the Bollinger Bands, indicating reduced volatility and signaling the potential for a significant market movement.
Additionally, the Moving Average Convergence and Divergence (MACD) indicator has formed a bullish crossover below the zero line, suggesting a recovery in bullish sentiment. A critical test for this recovery will be the ability to break and sustain momentum above the $0.00004 resistance level, which could define the market’s next directional move.

$SPONGE 1-Hour Chart Insights
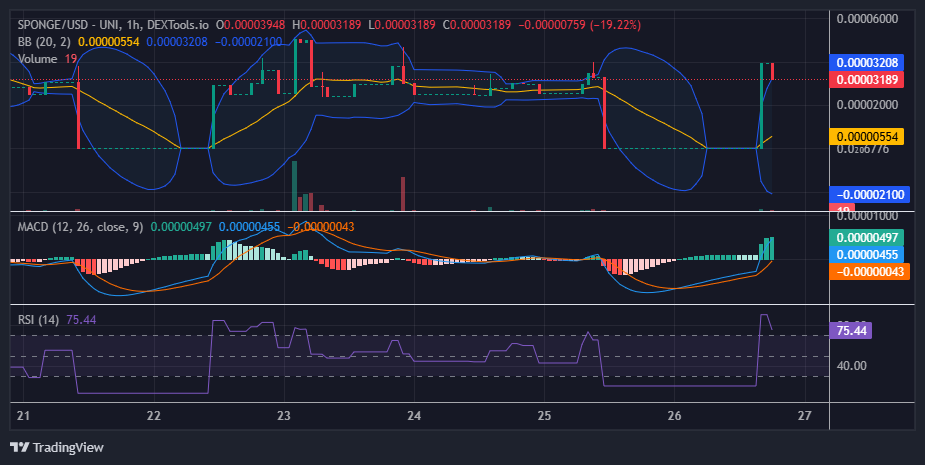
A closer look at the 1-hour chart reveals that $SPONGE is displaying significant volatility, resembling a rollercoaster pattern. The Relative Strength Index (RSI) highlights this fluctuation, with its line oscillating between the overbought and oversold regions, reflecting the market’s heightened volatility. The Bollinger Bands further confirm this dynamic, showing notable price activity within their range.
Additionally, the 20-day moving average indicates signs of a bullish recovery, as the moving average begins trending upward, signaling strengthening momentum in favor of the bulls.
Buy $SPONGE!
Merry Christmas to all the #SPONGERS around the world 🧽🎄
Now go touch some grass 💦💦 pic.twitter.com/8sPj37mlrK
— $SPONGE (@spongeoneth) December 25, 2024
Join the SPONGE community and be part of the next big crypto sensation! Buy Sponge ($SPONGE) today!