$SPONGE (SPONGE/USD) Positioned for a Breakout: Key Levels to Watch
Estimated Reading Time: 2 minutes
Don’t invest unless you’re prepared to lose all the money you invest. This is a high-risk investment and you are unlikely to be protected if something goes wrong. Take 2 minutes to learn more

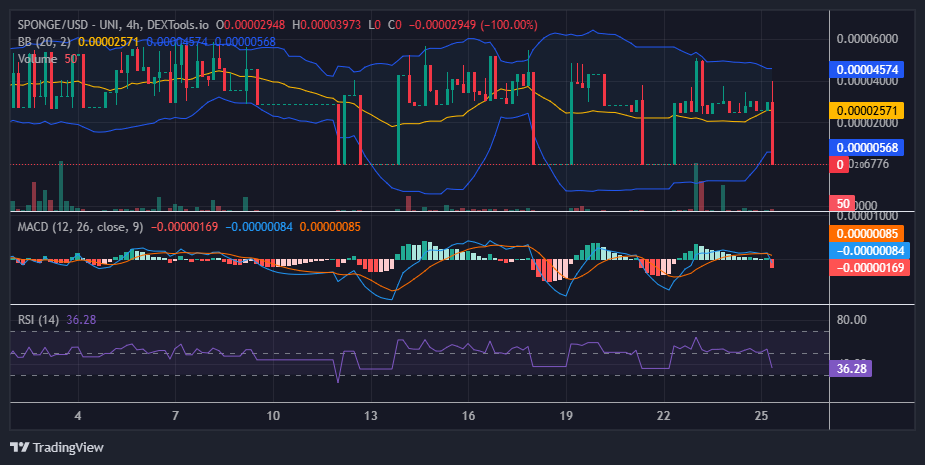
The digital asset $SPONGE (SPONGE/USD) is currently in a tense standoff between bullish and bearish forces. Despite persistent bearish pressure, the price has hovered around the $0.00003 level, demonstrating notable resilience. Recently, the bears managed to push the price down to $0.000025, but the bulls have fought back admirably, holding firm even as the market found a new low near $0.0000006. This unwavering defense of the critical $0.0000006 support level suggests that a significant price movement may be on the horizon. The bulls’ determination at this level highlights the potential for a breakout in the near term.
Key Market Dynamics:
- Resistance Levels: $0.00005, $0.000055, $0.000060
- Support Levels: $0.000020, $0.0000195, $0.000019
$SPONGE (SPONGE/USD) Technical Outlook
The $SPONGE market’s repeated attempts to break through the $0.00005 resistance zone, only to face persistent rejection, may signal an impending decisive move. The convergence of the Bollinger Bands indicates a potential squeeze, often a precursor to significant price volatility in either direction. The current crypto signal suggests a possible breakdown toward the $0.0000006 level, which the bulls recently defended and recovered from. While this might hint at bearish dominance, the fact that the Bollinger Bands still maintain substantial bandwidth suggests the bears may struggle to establish a sustained downward trend.
$SPONGE (SPONGE/USD) 1-Hour Chart Insights
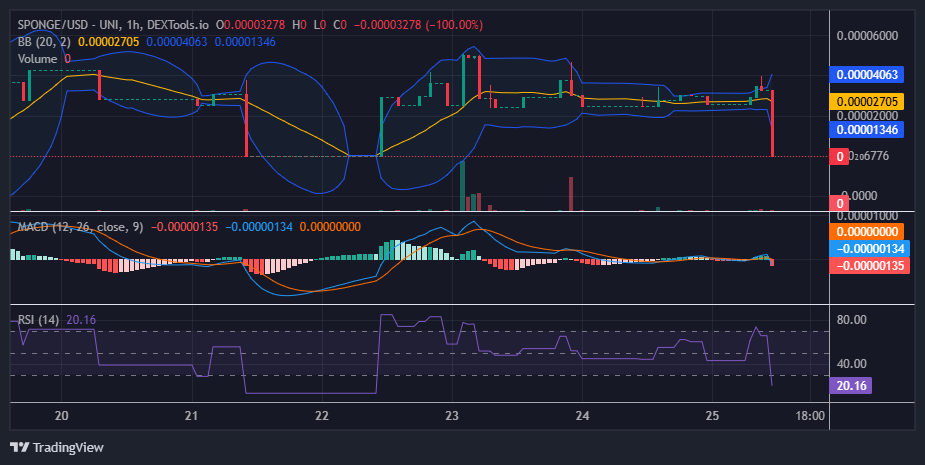
The market has remained relatively steady around the $0.00003 price level, despite a notable bearish candlestick that highlighted a drop to $0.0000006—an area the market recently tested. The Relative Strength Index (RSI) indicates oversold conditions in the current trading session, suggesting the potential for a rebound in the near future.
Buy SPONGE/USD!
Merry Christmas to all the #SPONGERS around the world 🧽🎄
Now go touch some grass 💦💦 pic.twitter.com/8sPj37mlrK
— $SPONGE (@spongeoneth) December 25, 2024
Join the SPONGE community and be part of the next big crypto sensation! Buy Sponge ($SPONGE) today!