Bitcoin (BTC/USD) Market Features Range-Bound Points
Estimated Reading Time: 3 minutes
Don’t invest unless you’re prepared to lose all the money you invest. This is a high-risk investment and you are unlikely to be protected if something goes wrong. Take 2 minutes to learn more

Free Crypto Signals Channel
Bitcoin Price Prediction – August 7
The BTC/USD market features range-bound points characterized by $20,000 and $25,000 over a long-term running basis. Price is currently experiencing a 0.27% negative, trading around $22,898 as of the time of writing today.
BTC/USD Market
Key Levels
Resistance levels: $25,000, $27,500, $30,000
Support levels: $20,000, $17,500, $15,500
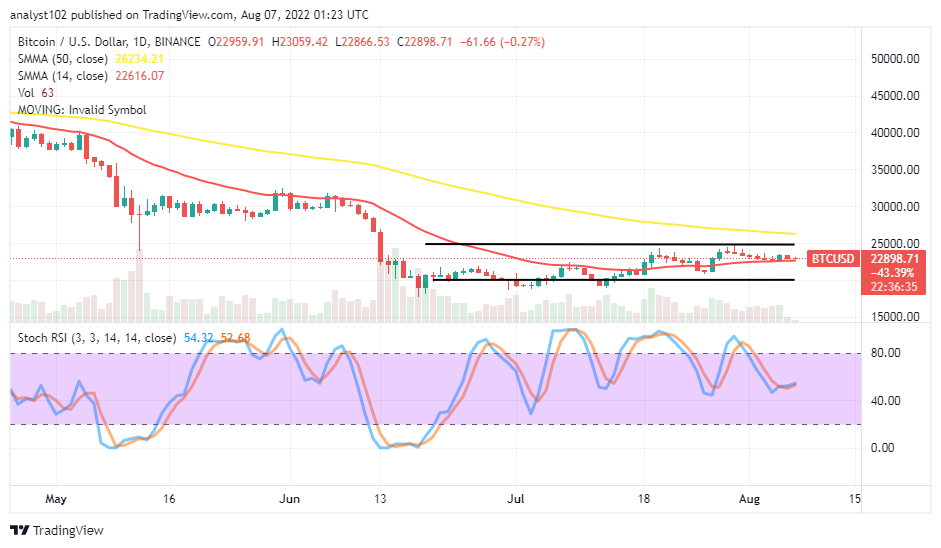
BTC/USD – Daily Chart
The BTC/USD daily chart pictures the crypto-economic market features range-bound points represented by $20,000 and $25,000. Precisely, the 14-day SMA indicator is at $22,616.07 underneath the 50-day SMA indicator, which is at $26,234.21. The smaller SMA is in the area of the range-bound spots. The Stochastic Oscillators have traveled southbound and got clogged at a psychological range zone not too far above the 40 range. The market may witness a pit stop around its current trading value.
Is it technically okay to place an order within the current range-bound spots of the BTC/USD market operation now?
The BTC/USD market features range-bound points bordering on $20,000 and $25,000 value lines. Active price action needed to occur for a timely achievement of the outcome of the order that has to execute within the current range-bound spots of the crypto-economic activities. Buyers have to stay alert while the price strives to rebound from a downward motion toward the lower range value line before considering a re-launch of buying order.
On the downside of the technical analysis, the key trading resistance level has been at the $25,000 level. Therefore, short-position players are to be on the lookout for rejections of price actions or a false breakout around the value line before considering making a comeback into the market. Sellers need to be wary of following the trend to the downside while price tends to move further in that direction.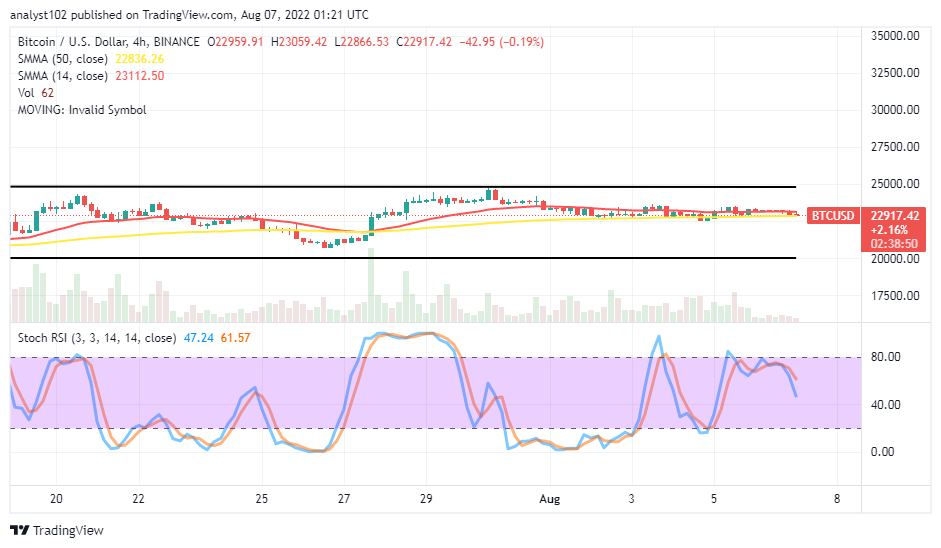
BTC/USD 4-hour Chart
The BTC/USD medium-term chart reveals the crypto market features range-bound points on the values of $20,000 and $25,000. The 14-day SMA trend line is at $23,112.50 above the $22,836.26, where the 50-day SMA trend line is. And they are both in the range value lines, pointing toward the east direction to indicate the market is moving sideways. The Stochastic Oscillators have crossed southbound from the range of 80, closely toward the range of 40. That signifies a declining motion is somewhat ongoing.
Note: Cryptosignals.org is not a financial advisor. Do your research before investing your funds in any financial asset or presented product or event. We are not responsible for your investing results.
You can purchase Lucky Block here. Buy LBLOCK