Tamadoge (TAMA/USD) Breaks Through $0.005 and Seeks Support
Estimated Reading Time: 3 minutes
Don’t invest unless you’re prepared to lose all the money you invest. This is a high-risk investment and you are unlikely to be protected if something goes wrong. Take 2 minutes to learn more
In the latest analysis of Tamadoge prices, it was observed that persistent bearish pressure compelled bullish investors to seek solace at a nearby support level approximately at $0.0045. However, subsequent price movements indicated a subtle shift towards the pivotal $0.005 threshold, suggesting an emerging bullish sentiment. Subsequently, the market witnessed a breakthrough beyond the $0.005 level, signifying a strengthening bullish momentum. Presently, the crypto signal suggests that bullish investors are now seeking support levels beyond this threshold.
Key Levels
- Resistance: $0.013, $0.014, and $0.015.
- Support: $0.0045, $0.0040, and $0.0035.
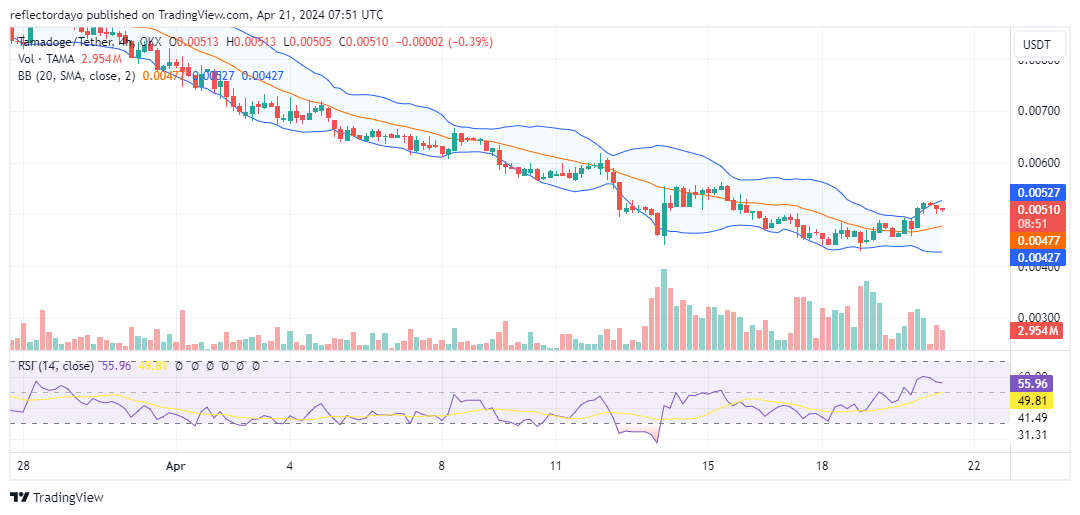
TAMA/USD Price Analysis: The Indicators’ Point of View
The current market sentiment is characterized by bullish attempts to reclaim the $0.005 price level, formerly a support level that transitioned into resistance during the recent bearish trend. Upon closer examination of the chart, a recurring pattern of bearish price rejections at this level is evident. This consistent refusal of bearish pressure at the $0.005 threshold is anticipated to reinforce it as a robust support, capable of sustaining the bullish trajectory of the market. Notably, the upper Bollinger Bands are indicative of this bullish activity, exhibiting an upward trend. Similarly, the 20-day moving average is beginning to show signs of upward momentum, further affirming the bullish sentiment.
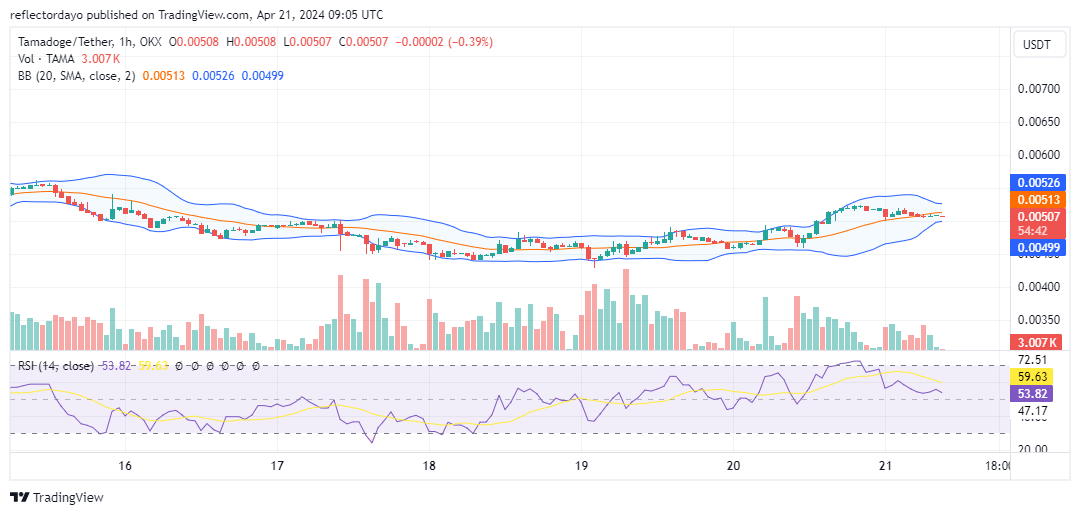
Tamadoge Short-Term Outlook: 1-Hour Chart
From an analysis of the 1-hour chart‘s price action, a notable observation is the stabilization of the Tamadoge prices around the $0.005 mark. The emergence of repeated dojis at this level indicates a significant bullish presence and a firm commitment from buyers to drive the market upward. Additionally, the convergence of the Bollinger Bands suggests a balance between supply and demand, resulting in decreased volatility. This convergence reinforces the bullish sentiment in this area, hinting at a potential market rebound from this level.
Buy Tamadoge!
Day 2 of the Tamadoge Pursuit contest!
The top player on the High Score leaderboard gets an $100 of $TAMA – on top of your regular share of prizes 🐶
The contest runs daily until April 25 🗓️
Get playing 👇
📱Android: https://t.co/h84PZcrkGa
📱 iOS: https://t.co/YGPcwP8XPD pic.twitter.com/nnFd6EIBjX— TAMADOGE (@Tamadogecoin) April 20, 2024
Do you want a coin that will be 100 times more valuable in the next few months? That is Tamadoge. Buy TAMA today!