Stacks (STX/USD): Is a New Bull Run on the Horizon?
Estimated Reading Time: 3 minutes
Don’t invest unless you’re prepared to lose all the money you invest. This is a high-risk investment and you are unlikely to be protected if something goes wrong. Take 2 minutes to learn more

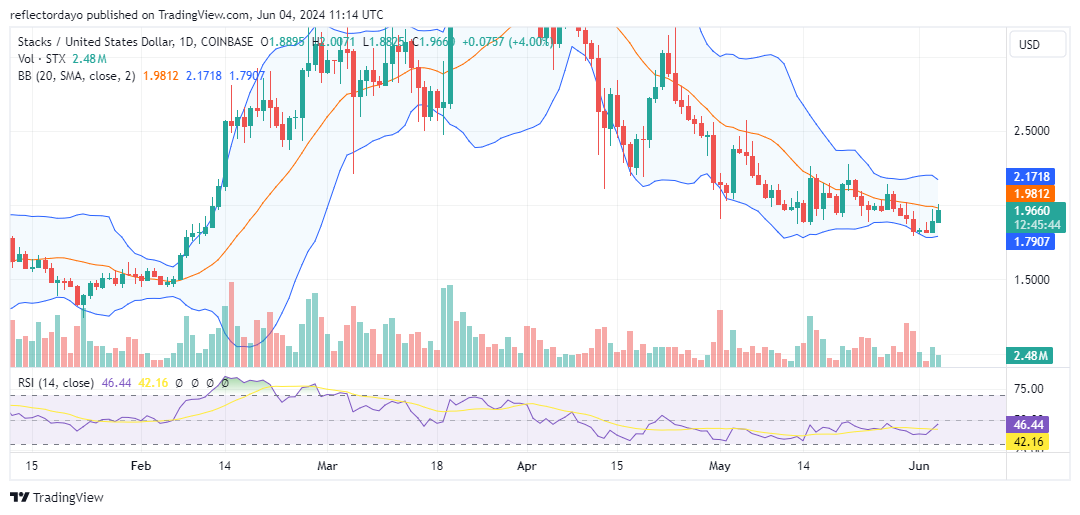
Stacks has been in a downtrend since early April, until bullish supports began to emerge. The first support appeared at the $2.3 price level around mid-April, significantly driving the market upward. However, this bounce resulted in a lower high, and the ensuing bear market broke below the $2.3 price level. Despite bullish momentum causing another price bounce, it also formed a lower high. In May, the $1.9 price level emerged as a stronger support, leading to sideways market movement. As May transitioned into June, the market broke below the $1.9 support level. However, with support at $1.83, the price rallied above $1.9 but remained under bearish pressure.
The Stacks Market Data
- STX/USD Price Now: $1.96
- STX/USD Market Cap: $2.9 billion
- STX/USD Circulating Supply: 1.4 billion STX
- STX/USD Total Supply: 1.8 billion STX
- STX/USD CoinMarketCap Ranking: #38
Key Levels
- Resistance: $2.00, $2.20, and $2.50
- Support: $1.80, $1.75, and $1.70.
The Stacks Market Through the Lens of Indicators
Following the emergence of the $1.90 price level as a support, the price action has ranged sideways along this level, suggesting that this support might be stronger than previous ones. However, the price action subsequently broke below this level before finding a pivotal bounce point and rallying back above $1.90. Considering the formation of lower highs since early April, bearish pressure remains strong in the Stacks market. Nevertheless, the sideways movement around the $1.90 price level indicates that bulls are gaining strength and the market may turn upward.
Current crypto signals, however, suggest a prevailing bearish momentum. The price action is below the 20-day moving average, and the RSI is below the 50 level of the Relative Strength Index. If bulls can maintain their position at the current level, they may eventually overcome the bearish pressure, leading to a potential bullish breakout.
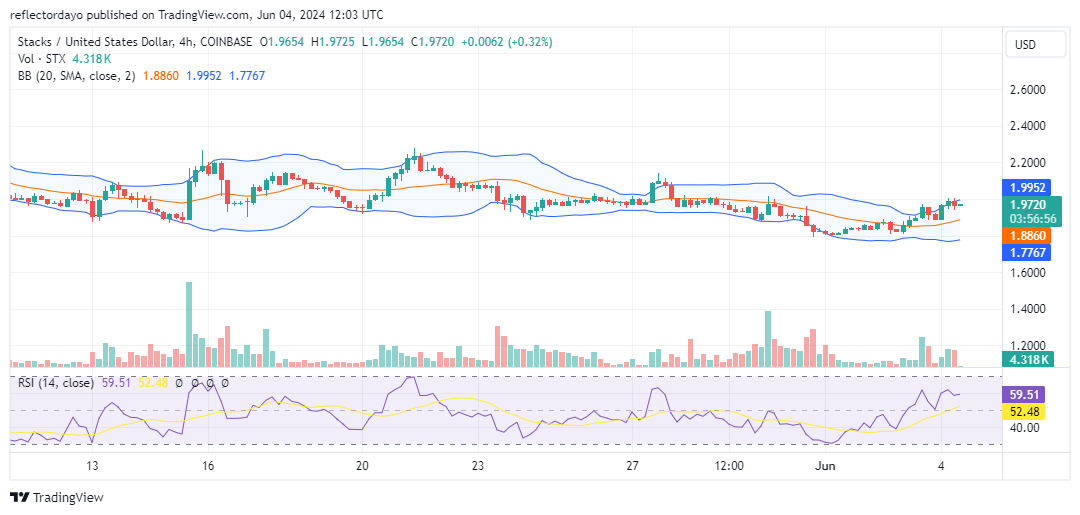
STX/USD Price Prediction: 4-Hour Chart Analysis
The 4-hour chart indicates that the bullish market has finally established itself at the key support level of $1.90, with the price action now approaching the $2.00 level. However, bearish resistance at this point is impeding the bull market’s recovery. Breaking through the critical $2.00 price level will likely provide significant bullish momentum, resulting in a more robust upward movement.