HyperLiquid (HYPE/USDT) Targets More Gains Amid Rising Momentum
Estimated Reading Time: 3 minutes
Don’t invest unless you’re prepared to lose all the money you invest. This is a high-risk investment and you are unlikely to be protected if something goes wrong. Take 2 minutes to learn more

After days of straight movement, the market for Hyperliquid against Tether is beginning to push upward, reflecting renewed buying interest. At the moment, the pair is preparing to build a base above the upper boundary of the Bollinger Bands. Also, the Stochastic RSI signals there is still room for a short-term improvement to the north. However, the current state of the pair requires caution, as building a base above the upper limit of the bands may lead to a pullback if momentum weakens.
Recently, Hyperliquid has broken above $51.64, pushing towards the $55.00 level, and $60 becomes visible. As it stands, this upward trend is likely to continue if the price can maintain its position above the moving averages.
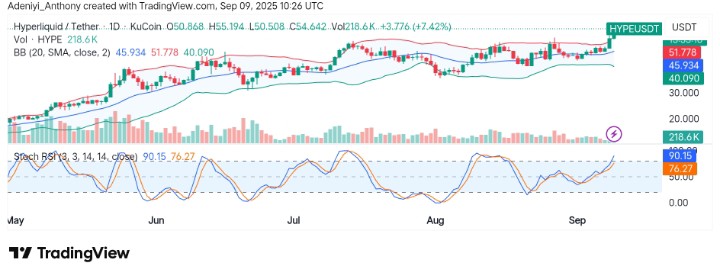
Currently, Hyperliquid trades at $54.642, recording over 218 thousand traded volumes on the daily timeframe.
Technical Indicators
Major Resistance Levels: $55.00, $60.00, and $64.00
Major Support Levels: $50.51, $45.91, and $40.50
Hyperliquid Technical Analysis
Technically, the market for Hyperliquid against Tether displays a bullish sentiment as the price reaches for the values on the limit of the Bollinger Bands. However, this condition suggests the pair is currently overvalued, indicating a pullback risk, but if the current price is maintained, a move towards $60.00 may materialize.
Also, the Stochastic RSI beneath the chart reads a value greater than 90 for the blue line, stating the pair is overbought. However, the upward-pointing line suggests the token is poised for a short-term gain, which attracts a slight pullback before continuation.
To this end, a continued momentum above $55.050 as Bands begins to expand would lead to further rally. However, the overbought condition of the momentum oscillator indicates the market may be bullish but nears exhaustion.
$HYPE is showing strength.
The trend line support is clear, and every retest has pushed price higher.
Now the key level is $52
Once that breaks, momentum could accelerate further. pic.twitter.com/e7pLuTwW4X
— Crypto King (@CryptoKing4Ever) September 8, 2025
Meanwhile, in an earlier post by @Cryptoking4ever, it was recorded that Hype had pushed far above the support line, and the limit at that time was $52, which has been clear. This suggests that the token is poised for more gains.
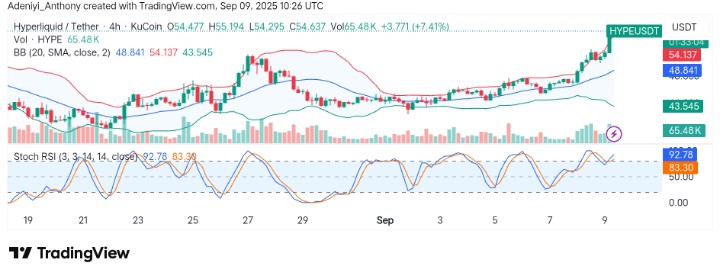
HYPE/USDT Analysis: Building Intraday Momentum
On the 4H chart, HYPE/USDT continues to trade bullishly, moving above the upper Bollinger Band, seeking a space in the $55.00 region. The volume on this timeframe appears to be rising as the Stochastic RSI signals more upside in the coming session.
In this timeframe, the chart revealed that the price has been ranging between $53.00 and $48.00; the latter is the current support and low-risk entry point if the pair drops value. However, a fall below this level would indicate further depths, but the market suggests a short-term buying opportunity.
You can purchase crypto coins here. Buy Crypto