Hyperliquid (HYPE/USDT) Shows Early Signs of Bullish Continuation Above Key Levels
Estimated Reading Time: 3 minutes
Don’t invest unless you’re prepared to lose all the money you invest. This is a high-risk investment and you are unlikely to be protected if something goes wrong. Take 2 minutes to learn more

The market for Hyperliquid against Tether once again shows sign of impending upside move after its strong rally earlier in the year. As it stands, the price is now showing resilience above the $42–$44 region.
As it stands, the market sentiment leans cautiously bullish, with buyers gradually regaining control, with the recent uptick in volume suggests a MACD bullish crossover and a shift in momentum
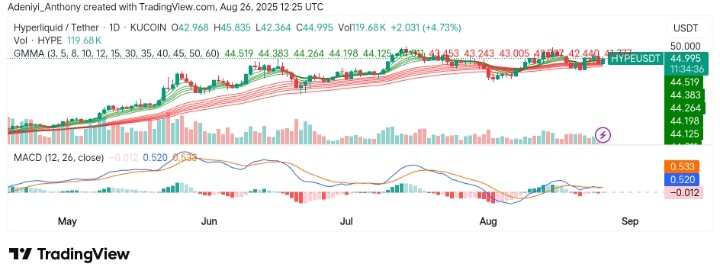
Currently, Hyperliquid trades at $44.995 with over 119 thousand traded volumes.
Technical Indicators
Major Resistance Levels: $46.80, $49.50, and $52.70
Major Support Levels: $43.45, $40.80, and $38.20
Hyperliquid Technical Analysis
In a recent price action, Hyperliquid appears to be above the $44.99 level, climbing 4.73% on the daily timeframe. Also, the GMMA shows signs of compression and a potential re-expansion. This suggests that the short-term buyers are aligning with longer-term trend participants and an upside movement may be next.
However, the MACD indicator beneath the chart appear to be taking things slow above the signal line, confirming early bullish momentum after a prolonged period of consolidation. As it stands, the combination of both indicators suggest that the next move could be a push towards higher resistance levels if buyers maintain volume support. To this end, a breakout strategy can play out here if the price closes above $46.80 to confirm bullish continuation towards $49.50–$52.70. On the downside, a break below $42.30 could shift sentiment bearish and expose $40.80.
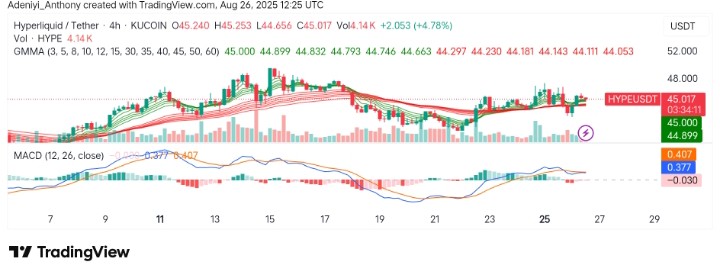
HYPE/USDT 4H Analysis: Chart Confirms Short-Term Strength
On the 4H timeframe, HYPE/USDT trades firmly above $44.00, showing resilience after testing the support zone. Moreover, it is important to state that the GMMA bands are tightening, suggesting the possibility of short-term pullback before expansion in the near term.
Also, the MACD beneath the chart is showing a weak bearish divergence. However, the histogram appears to be flattened, hinting at reduced selling pressure. This price structure indicates a potential higher low forming near $44.7755, reinforcing bullish sentiment.
To this end, a breakout above $46 on this timeframe could align with the daily bullish continuation structure and volume gradually building.
As it stands, Hyperliquid may continue to see more upside, as a tweet by @hyperliquidx made it known that Hyperliquid has reached a new all-time high under 24 hours. This marks Hyperliquid as the second largest spot for trading BTC across centralized and decentralized exchanges.
Spot volumes on Hyperliquid reached a new 24h ATH of $3.4B. This was driven largely by growth in BTC and ETH deposits and spot volume, facilitated by @hyperunit.
This makes Hyperliquid the second largest venue to trade spot BTC across both centralized and decentralized…
— Hyperliquid (@HyperliquidX) August 25, 2025
You can purchase crypto coins here. Buy Crypto