Hyperliquid (HYPE/USDT) Pullback for Another Breakout
Estimated Reading Time: 3 minutes
Don’t invest unless you’re prepared to lose all the money you invest. This is a high-risk investment and you are unlikely to be protected if something goes wrong. Take 2 minutes to learn more

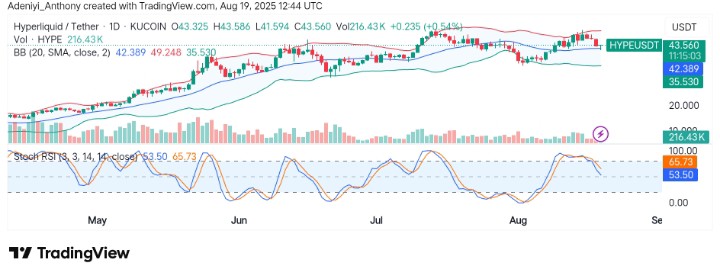
Market sentiment for Hyperliquid against Tether remains bullish. The pair’s price is trending upward with minor pullbacks, but is now consolidating tightly as the Stochastic oscillator declines.
To this end, the market volume appears to be increasing within tightened Bollinger Bands, signaling optimism as market participants look for a clear directional movement.
Currently, Hyperliquid trades at $43.560 with over 216 thousand daily traded volumes.
Technical Indicators
Major Resistance Levels: $43.60, $44.25, and $45.00
Major Support Levels: $42.38, $41.60, and $40.50
Hyperliquid Technical Analysis
The analysis for Hyperliquid against Tether on the daily timeframe shows the market is consolidating as the price ranges within a well-defined region. However, it is obvious the bulls are trying to push higher but encountering resistance levels, leading to pullback each time the price wants to ride the upper Bollinger Bands.
On one side of the chart, the Bollinger Bands indicate an imminent breakout is on the horizon, while on the other, the Stochastic RSI signals the pair is neither overbought nor oversold as the indicator presents the height of uncertainty in the market.
To this end, as the volume increases, a break above $43.60 after the retest of the immediate support at $42.38 might spark a strong bullish move in the near term. However, a move below $42.30 would suggest a deeper retracement.
HYPE/USDT Analysis: A Pullback or Setup for Another Breakout?
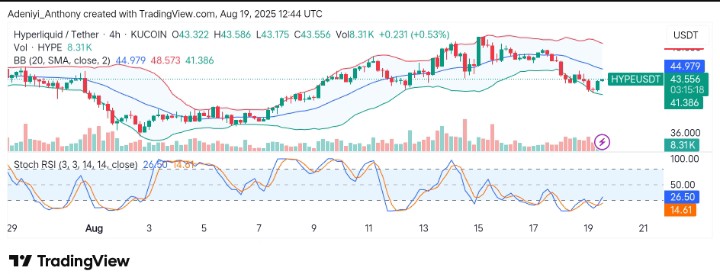
On the 4-hour chart, the analysis of HYPE/USDT shows the pair is strong, consolidating within a tight space of the Bollinger Bands. However, the bands appear to be bent to the south with a relatively low volume, suggesting the market awaits a trigger.
The Stochastic RSI beneath the chart shows the pair is oversold, with the lines moving across the face of the 20-mark level with the blue line pointing to the north, suggesting if momentum resumes, the pair might trend higher again.
To this end, a break above $44.98 would increase the odds of pushing higher in the coming session; otherwise, a break below $41.38 would support further bearish actions.
Meanwhile, in the midst of the struggle for dominance, @Hyperliquidx has shared a notification of recent development within the ecosystem which could bring about more participations as time goes on.
Spot trading against multiple quote assets has been activated on Hyperliquid mainnet. The USDT0 team completed their deployment today, which automatically deployed the HYPE/USDT pair.
HIP-1 base asset deployments can specify any quote asset as their first spot pair deployment.…
— Hyperliquid (@HyperliquidX) August 18, 2025
You can purchase crypto coins here. Buy Crypto