0X (ZRXUSD) Reverts Toward Its Former Price Range
Estimated Reading Time: 2 minutes
Don’t invest unless you’re prepared to lose all the money you invest. This is a high-risk investment and you are unlikely to be protected if something goes wrong. Take 2 minutes to learn more

Free Crypto Signals Channel
ZRXUSD Analysis – The Market Reverts Towards its Former Price Range
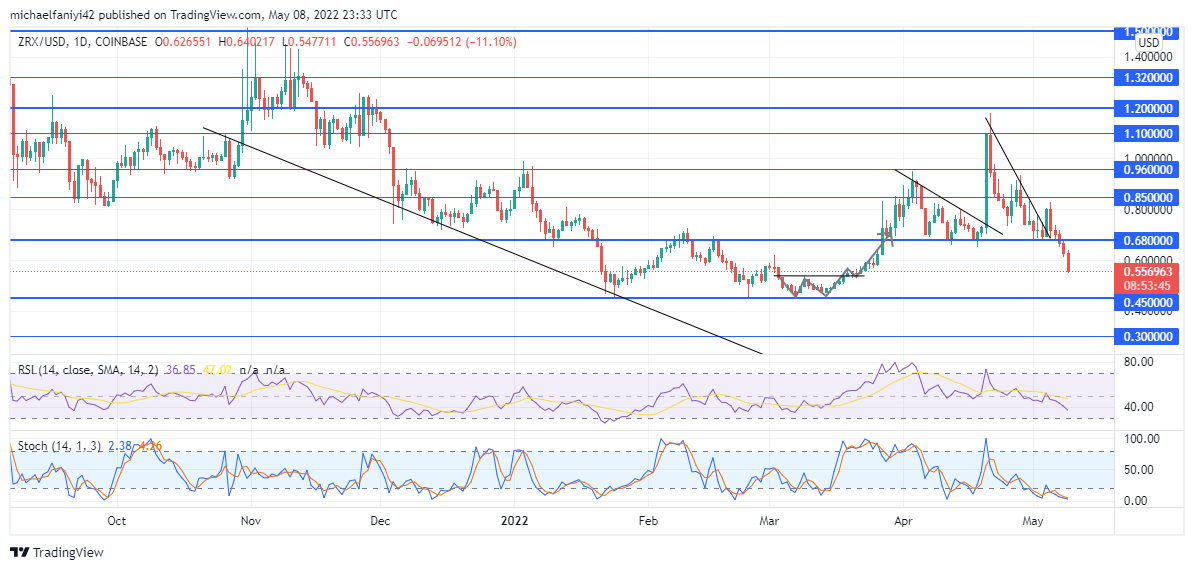
ZRXUSD reverts towards its former price range after slipping past its current support level at $0.680. This is in contrast to what has been observed in the market since the beginning of April. Just before the price drop, the market exhibited an upward skip to $1.200. However, 0x has been continuously weathered down until it reverts to its previous support level.
ZRXUSD Significant Zones
Resistance Levels: $1.200, $0.960
Support Levels: $0.450, $0.680
ZRXUSD market began April in a bullish mood after it had just busted through the $0.680 significant level that was poised as a resistance. The price rose to $0.960 before it was weathered down with consecutive lower highs. However, $0.680 remained as solid support for the market. This gave the bulls more impetus to cause an 80% price surge. But the coin also reverts to the support level.
Not only did the coin revert back to the $0.680 support level, but bears began to play on the market, which ensured it slipped below its current support level. The price is now descending towards a former support level at $0.450. The RSI (Relative Strength Index) charts show the current superiority of the bears as their line plunges below the mid-level. The Stochastic is already in an oversold situation.

Market Expectations
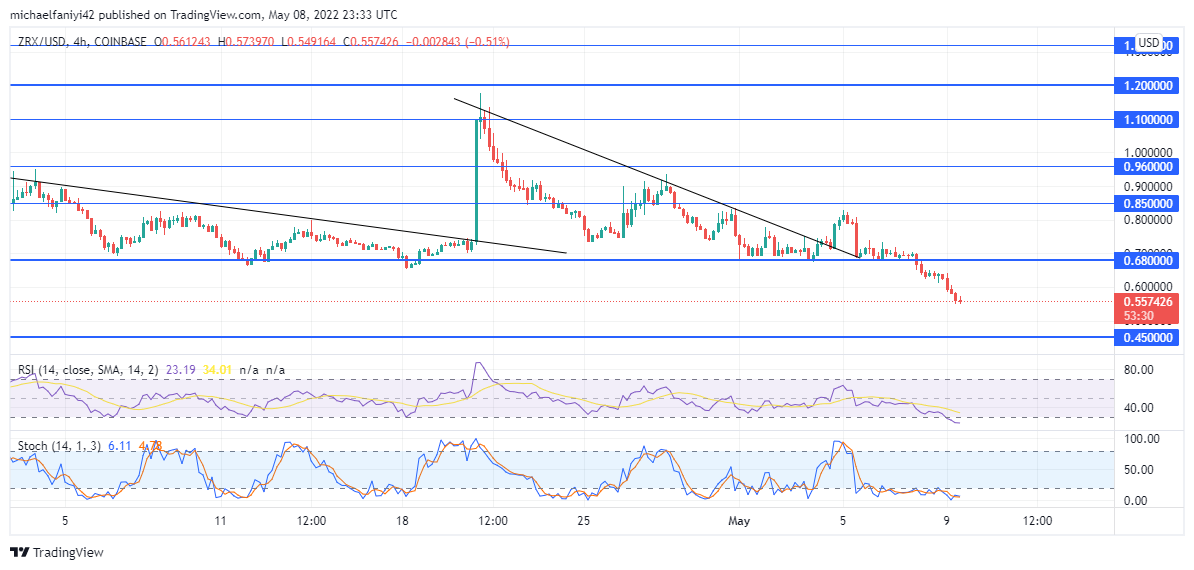
The 4-hour chart shows that a vigorous ranging process began at the beginning of May and this rumbled on till the 8th of May when the price eventually dropped below the support line. Since May the 5th, bears have taken over the market as the RSI plunged to below the middle and the Stochastic dropped further into the oversold region. A retracement would confirm the market’s destination towards $0.450.
How To Buy Lucky Block
Note: Cryptosignals.org is not a financial advisor. Do your research before investing your funds in any financial asset or presented product or event. We are not responsible for your investing results.