Ethereum (ETH/USD) Price Lowers in the Bullish Flag Shape
Estimated Reading Time: 3 minutes
Don’t invest unless you’re prepared to lose all the money you invest. This is a high-risk investment and you are unlikely to be protected if something goes wrong. Take 2 minutes to learn more

Free Crypto Signals Channel
Ethereum Price Prediction – April 25
The ETH/USD price lowers in the bullish flag shape. And the higher probability has it that the crypto economy is on the move to get a stance to swing upward back soon as it trades between $2,925 and $2,796 value-lines at a negative percentage of 2.31.
ETH/USD Market
Key Levels:
Resistance levels: $3,000, $3,250, $3,500
Support levels: $2,750, $2,500, $2,250
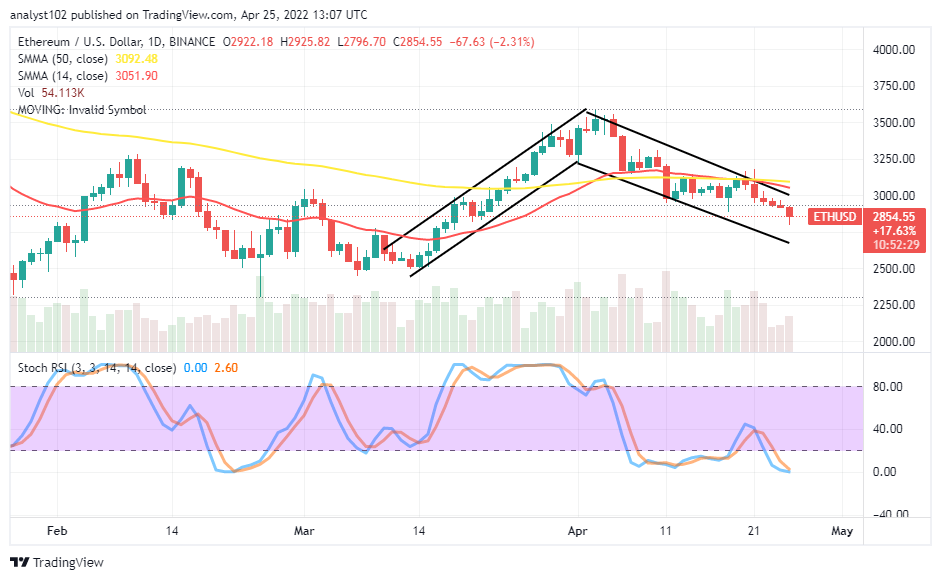
ETH/USD – Daily Chart
The ETH/USD daily chart showcases the crypto-economic price lowers in the bullish flag shape. The 14-day SMA indicator has briefly intercepted the 50-day SMA indicator to the south side closely above the $3,000 resistance level. Variant bearish candlesticks have occurred in the crypto business operations, gradually approaching a critical support level at $2,750. The Stochastic Oscillators have once again crossed southbound from the range of 40 into the oversold region. And they are closed at the range of zero, trying to close their lines within.
As the ETH/USD price lowers in the bullish flag shape, will the bears exert more forces beyond the $2,750 critical support level?
There can be more downs beyond the $2,750 critical support level in the long term run. If the ETH/USD market bulls fail to locate a stance to build their energy upon, before the value line as the crypto-economic price lowers within the bullish shape drawn afterward. However, the general overriding verdict remains that the crypto trade will soon regain its lost momentum.
On the downside of the technical analysis, the ETH/USD market bears needed to push the current downing force to a logical completion around the $2,750 support level. A sudden sustainable breakdown at the value line mentioned earlier may not happen in the near term. The present appearance of the Stochastic Oscillators in the oversold region suggests there can be an attempt by the market to make a rebound in no time.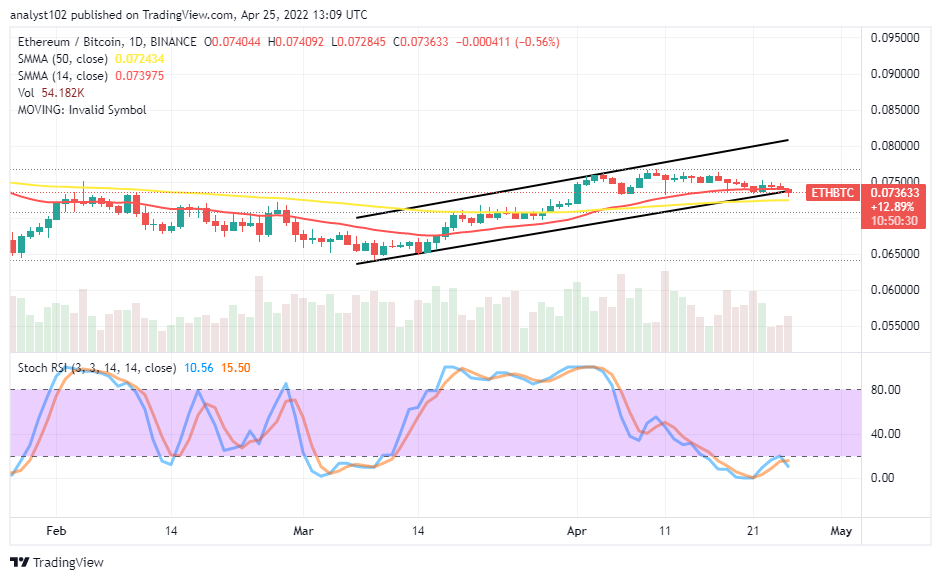
ETH/BTC Price Analysis
In comparison, Ethereum is holding back its positions against the trending worth of Bitcoin over a couple of sessions at a high trading zone around the trend line of the smaller SMA. The 14-day SMA indicator is closely above the 50-day SMA indicator. The bullish trend lines are intact to showcase the strength of the base crypto. The Stochastic Oscillators are in the oversold region, seemingly attempting to cross their lines southbound. That signifies the counter crypto is also striving to exert a force on its base trading instrument. If a or two bullish candlesticks re-surface around the SMA trend lines, it would mean ETH will resume its dominance forces.
Note: Cryptosignals.org is not a financial advisor. Do your research before investing your funds in any financial asset or presented product or event. We are not responsible for your investing results.
You can purchase Lucky Block here. Buy LBlock: