Chainlink Loses Current Support and Risks Falling to $11.96
Estimated Reading Time: 3 minutes
Don’t invest unless you’re prepared to lose all the money you invest. This is a high-risk investment and you are unlikely to be protected if something goes wrong. Take 2 minutes to learn more

Chainlink (LINK) Long-Term Analysis: Bearish
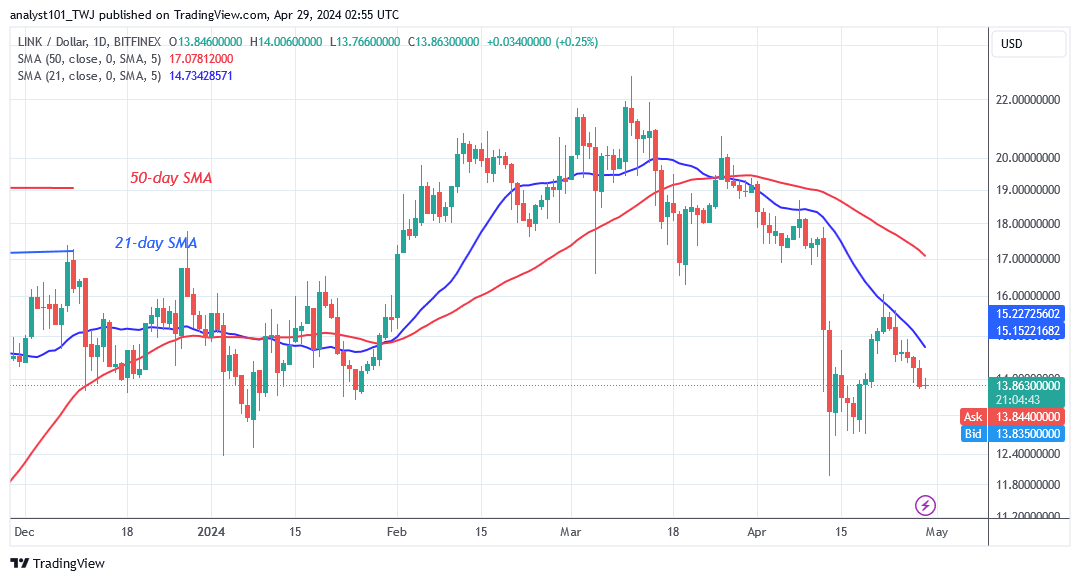
Chainlink’s (LINK) price begins a range-bound move above the $12.75 support and risks falling to $11.96. Since April 13, 2024, the cryptocurrency asset has traded above the $12.75 support but below the moving average lines and resistance at $16. For the previous week, the altcoin has fluctuated within its range before resuming its trend.
The bulls attempted to retest the resistance level but were rebuffed. Chainlink has declined and is now consolidating in the center of its price range. On the upside, if the altcoin rebounds above the $14 support level, it will rise above the 21-day SMA. The bullish momentum will continue to the 50-day SMA or $17 high. If the price breaks above the 50-day simple moving average, the altcoin will return to its prior high of $22.83.
Should the current $14 support level be breached, Chainlink’s low points would be $11.96 and $10.55, respectively.
Technical indicators:
Major Resistance Levels – $8.00, $10.00, $12.00
Major Support Levels – $6.00, $4.00, $2.00
Chainlink (LINK) Indicator Analysis
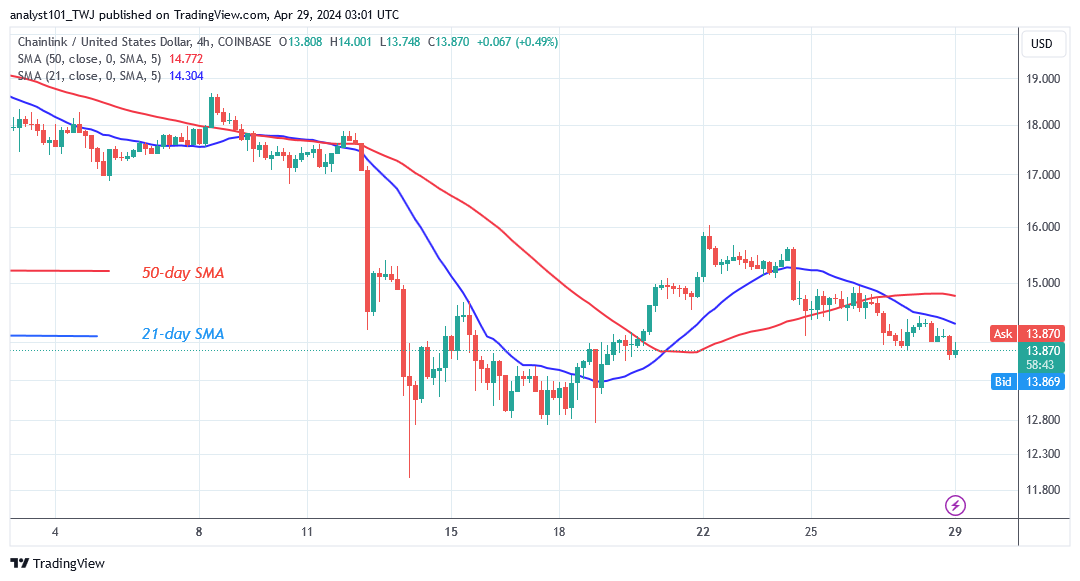
Given the current selling pressure, the price bars have reverted to below the moving average lines. On both charts, the LINK price displays a negative crossover, with the 21-day SMA crossing below the 50-day SMA, indicating a bearish signal. However, the negative signal has faded as the altcoin consolidates above the $12.75 support.
What Is the Next Direction for Chainlink (LINK)?
Chainlink’s price is currently trading sideways below the $16 resistance level but risks falling to $11.96. The altcoin has plummeted after encountering resistance at $16. LINK is hovering above the $14 support level as it resumes its upward trend. The altcoin is trading modestly, but a bullish trend will begin if it rebounds above its current support. The crypto signal is negative as the altcoin loses its current support.
You can purchase Lucky Block here. Buy LBLOCK
Note: Cryptosignals.org is not a financial advisor. Do your research before investing your funds in any financial asset or presented product or event. We are not responsible for your investing result