Wall Street Memes (WSM/USD) Price Holds on, Waxing Energy
Estimated Reading Time: 3 minutes
Don’t invest unless you’re prepared to lose all the money you invest. This is a high-risk investment and you are unlikely to be protected if something goes wrong. Take 2 minutes to learn more
Wall Street Memes Price Prediction – May 21
A series of pricing systems are now in place, showcasing that both sellers and buyers in the business deals that paired Wall Street Memes coin with the valuation of the American currency are now subjected to an indecision situation, given that the price holds on a basement, waxing energy in its slow-moving paces.
Despite current market indecision, prevailing price action continues to consolidate around key support thresholds—namely the lower bounds of the Bollinger Bands and the psychologically significant zones near $0.0005 and $0.001. This suggests that the higher-probability strategic posture remains biased toward accumulation at these levels, in anticipation of a potential large-scale bullish reversal aligned with the broader projected rebound trajectory.
WSM/USD Market
Key Levels
Resistance levels: $0.0015, $0.002, $0.0025
Support levels: $0.0005, $0.0004, $0.0003
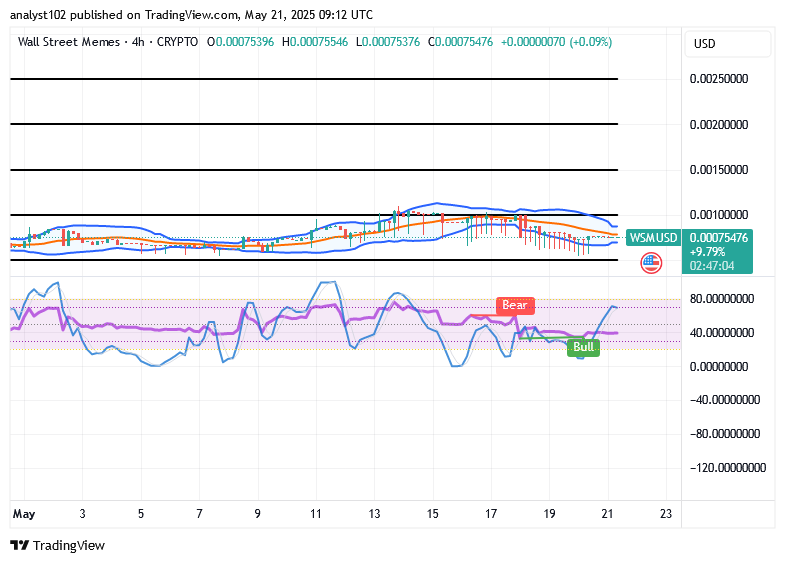
WSM/USD – 4-hour Chart
The WSM/USD 4-hour chart illustrates that the crypto holds on a basement, waxing energy in its slow-moving price action.
The Bollinger Bands are being slowly and tactically positioned to portend a pattern that denotes a bullish flag shape within the trade territories of $0.001 and $0.0005. The stochastic oscillators are swerving on a bullish threshold, affirming that buying forces are accumulating catalysts.
Is the WSM/USD trade merely consolidating above $0.0005—suggesting caution against selling near the $0.001 support zone?
The two trade lines still serve as the primary accumulation zones, even as the WSM/USD market shows potential for continued range-bound movement, given that the crypto-economic price holds on a basement, waxing energy in its outlooks.
With price action stabilizing just below the $0.001 mark, the WSM/USD market appears to be constructing a robust foundation for sustained bullish momentum. Technical indicators align in favor of accumulation, reinforcing a structurally sound setup for long-term upside potential. Opportunistic entries at current levels favor strategic investors, while short-term fluctuations remain marginal relative to the broader, upward trajectory.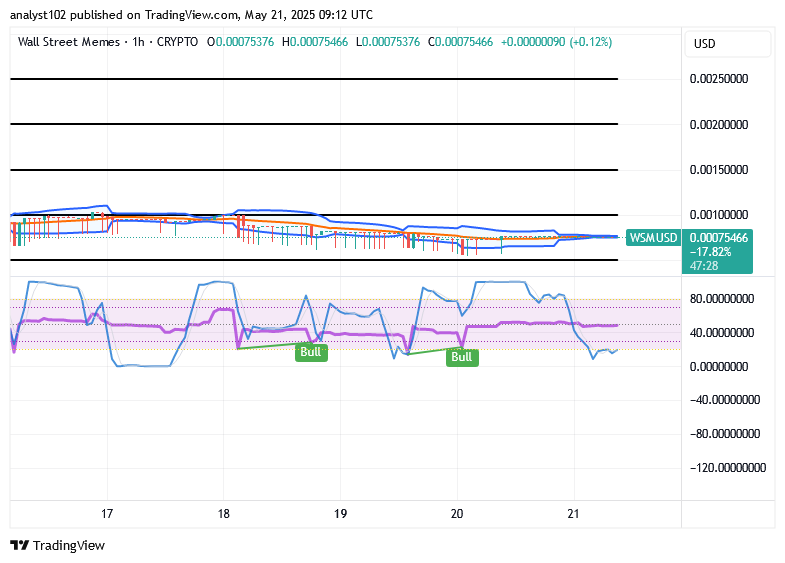
WSM/USD 1-hour chart
The 1-hour chart reflects that the crypto-economic operation holds on a basement, waxing energy in its outlooks.
The Bollinger Bands have closely been stretching eastward in a conjoint form within the values of $0.001 and $0.0005. The stochastic oscillators have stepped southbound into the oversold region, firmly holding on to a bullish signal notes formation. This shows that shorting position orders lack the potency of prevailing at this point.
$WSM / $USDT is now tradeable on #Bybit Perpetuals, offering increased liquidity, leverage options, and real-time trading opportunities for investors.
$WSM community, we saw your Tweets! 👏$WSM / $USDT is now tradeable on #Bybit Perpetuals.
— Bybit (@Bybit_Official) October 13, 2023
Trade here: https://t.co/le4XyVyXaZ
Also want your project listed? Share your suggestions here:https://t.co/W7EWJVVNV5 https://t.co/XgXoL7g0rF
