Zcash (ZEC/USD) Selling Trend Tilts Market Equilibrium
Estimated Reading Time: 3 minutes
Don’t invest unless you’re prepared to lose all the money you invest. This is a high-risk investment and you are unlikely to be protected if something goes wrong. Take 2 minutes to learn more
The Zcash market has reached a state of equilibrium following bullish intervention at the $20 price level, which initiated a shift in market sentiment towards a bullish trajectory. However, this upward momentum was met with bearish resistance at $24. The subsequent presence of bears at the $24 price level has reinstated equilibrium within the range of $20 and $24. Presently, the market is experiencing a downward slide as bearish forces persist.
Zcash Market Data
- ZEC/USD Price Now: $22.41
- ZEC/USD Market Cap: $363 million
- ZEC/USD Circulating Supply: 16 million
- ZEC/USD Total Supply: 16 million
- ZEC/USD CoinMarketCap Ranking: #169
Key Levels
- Resistance: $24.00, $25.00, and $26.50
- Support: $21.00, $20.00, and $19.00.
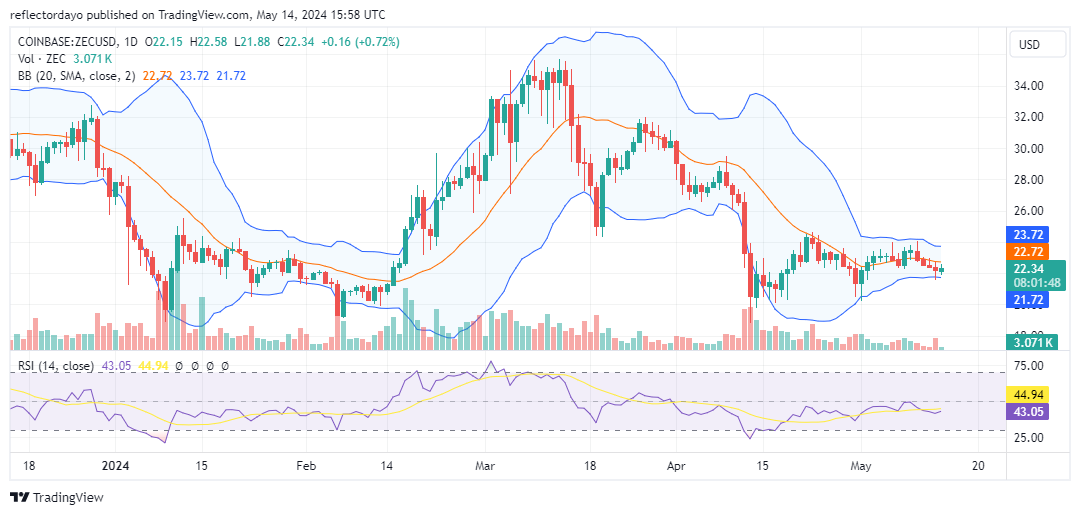
Zcash Through the Lens of Indicators
While the overall trend for Zcash remains bearish with a gradual decline, the market experienced a minor gain of around 2% today. Initially, a bullish surge drove the price upwards, with bulls briefly capturing the $24 level. This surge, however, resulted in a contraction of the Bollinger Bands indicator, signifying a decrease in market volatility as buying and selling pressure reached temporary equilibrium.
However, the price action has since fallen below the key 20-day moving average. The Relative Strength Index (RSI) has indicated weak momentum since early April and has approached a potential breakout above the 50 level. However, resistance from bears at the $24 price point prevented the RSI from crossing this threshold.
The current convergence of the Bollinger Bands suggests a potential breakout is imminent. However, given this crypto signal of prevailing bearish bias indicated by other technical indicators, the breakout is more likely to be downward.
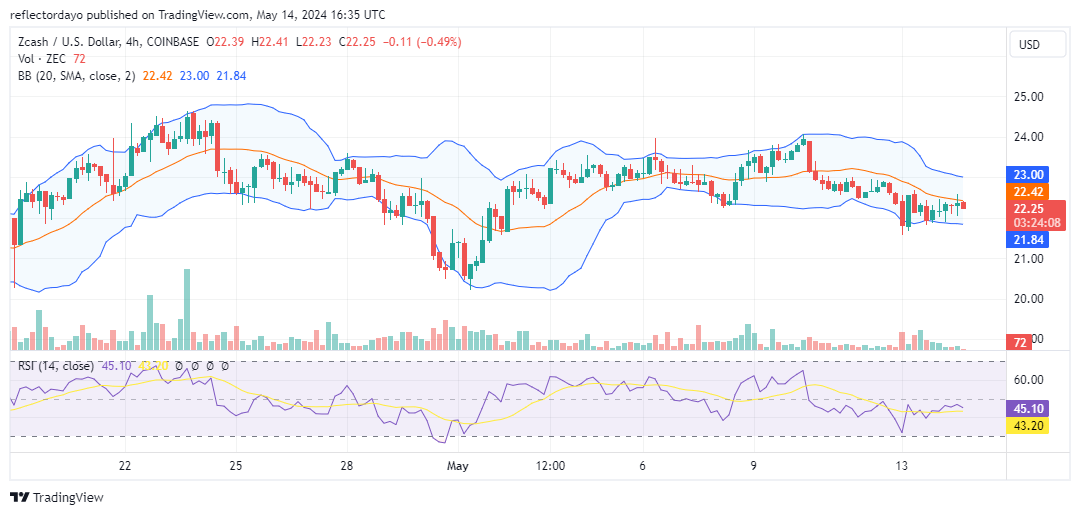
ZEC/USD Price Prediction: 4-Hour Chart Analysis
The four-hour chart reinforces the overall bearish sentiment. Here, the price action remains firmly below the 20-day moving average, highlighting a stronger bearish bias compared to the daily timeframe. However, there are signs of a potential bullish resurgence near the $22 support level. If bulls can maintain control at this level, a short-term upward breakout may occur, leading to a price recovery rally.