Bitcoin (BTC/USD) Market Indicates Bearish Pressure Looming
Estimated Reading Time: 3 minutes
Don’t invest unless you’re prepared to lose all the money you invest. This is a high-risk investment and you are unlikely to be protected if something goes wrong. Take 2 minutes to learn more

Bitcoin Price Prediction – December 16
BTC/USD market indicates bearish pressure looming despite sustained momentum. A major decline is highly probable, though for a while.
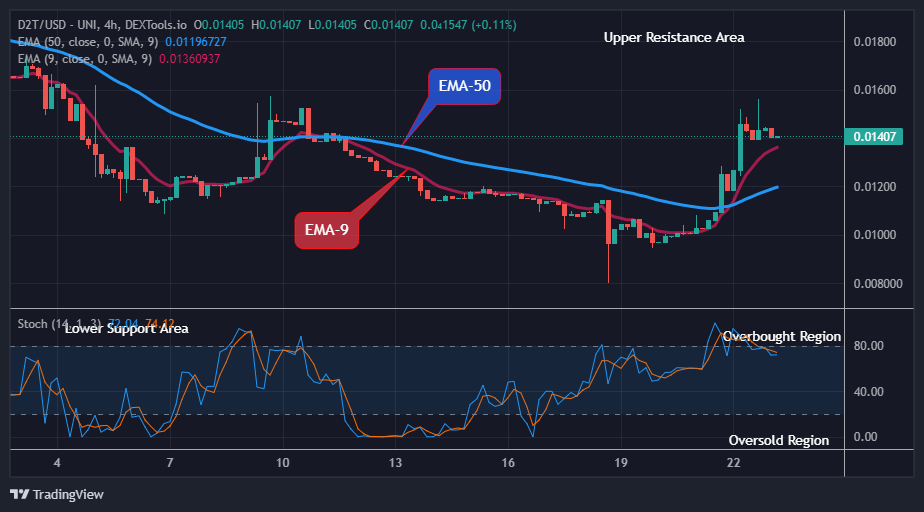
The chart shows critical signals from key indicators suggesting bearish sentiment might emerge. The Relative Strength Index (RSI) indicates a bearish divergence, with the price making higher highs while the RSI trends lower. This typically signals weakening momentum, which could lead to a price correction. The RSI remains near overbought territory at 63.90, meaning BTCUSD has limited upside room before exhaustion sets in.
BTC/USD Market Key Levels:
Resistance Levels: $100,000, $110,000, $115,000
Support Levels: $90,000, $73,840, $66,780
BTCUSD – Daily Chart
The BTCUSD daily chart shows that the market may retrace from the premium zone.
BTC/USD has formed a higher high near $104,000, marking a strong resistance level. Despite this bullish advance, the market has struggled to hold above $100,000, showing indecisiveness.
The support trendline, which currently sits around $97,500, has kept prices afloat, but any breach below this line could accelerate selling pressure. The chart also highlights key support levels at $90,000 and $88,710, where buyers might attempt to regain control if a decline occurs.

What is the likely projection of BTCUSD?
The projection for BTCUSD suggests that while short-term upside potential remains, a correction is likely in the medium term. If the price fails to break and holds above $104,000, we may see BTCUSD revisiting the $90,000 support level.

BTC/USD – Four-Hour Chart
The BTCUSD 4-hour chart shows a clear rejection near the $104,000 resistance zone, with sellers defending this level aggressively. The price is hovering near $100,000, but failure to hold this psychological support could trigger a drop toward the rising trendline at $96,000.
The RSI is showing weakening momentum, currently at 60.59, and trending downward, signaling reduced buying pressure. If the support at $97,501 breaks, BTCUSD may accelerate its decline toward $90,000 or the $88,713 support zone.
Bitcoin (BTC) Current Statistics
The current price: $101,940
Market Capitalization: $2,010,000,000,000
Trading Volume: $57,220,000,000
You can purchase Bitcoin here. Buy BTC