Helium (HNT/USD) Resumes Upward Momentum
Estimated Reading Time: 2 minutes
Don’t invest unless you’re prepared to lose all the money you invest. This is a high-risk investment and you are unlikely to be protected if something goes wrong. Take 2 minutes to learn more
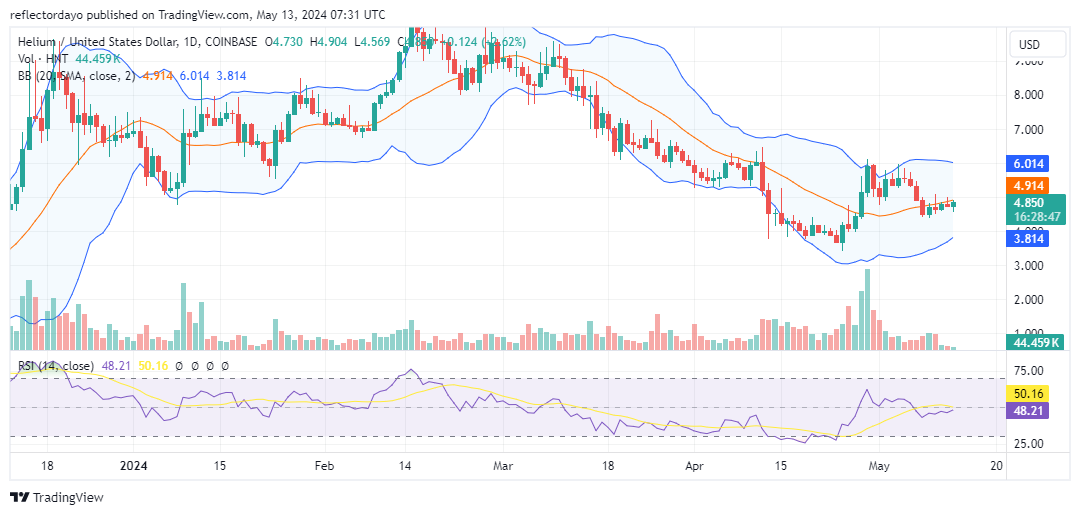
The Helium market has regained its upward momentum as bullish forces intervened at the $4.5 price level to maintain the positive price surge witnessed on April 29th, which peaked at $6.00. Market sentiment turned notably bullish around the $4.5 threshold, serving as a pivotal point where substantial upward momentum was achieved in late April, ultimately leading to the peak at the $6.00 price level.
Helium Market Data
- HNT/USD Price Now: $4.85
- HNT/USD Market Cap: $781 million
- HNT/USD Circulating Supply: 161 million
- HNT/USD Total Supply: 161 million
- HNT/USD CoinMarketCap Ranking: #95
Key Levels
- Resistance: $5.50, $6.00, and $6.50
- Support: $4.00, $3.50, and $3.00.
Helium Through the Lens of Indicators
Helium traders promptly capitalized on the $6.00 price level to secure profits, precipitating a notable shift in sentiment towards bearishness, thereby reverting the market’s trajectory to a bearish stance. Nevertheless, traders acknowledged the significance of the $4.5 price level, which served as a critical entry point for market participants in late April. Once more, the price action is exhibiting an upward trend from this juncture, registering a moderate gain of 2.44%.
However, despite the emergence of a bullish candlestick today, indicative of positive market sentiment, technical indicators suggest a retracement to the equilibrium point. While the bullish hammer candlestick signals bullish activity, it appears to denote merely a recovery towards the equilibrium level.
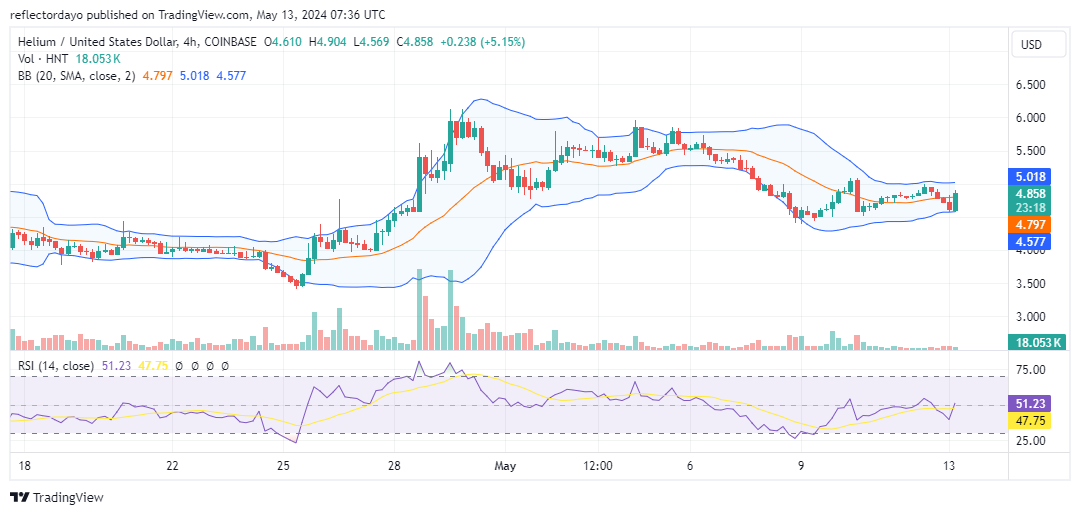
HNT/USD Price Prediction: 4-Hour Chart Analysis
Upon closer examination of the smaller timeframe, it becomes apparent that bullish investors are striving to sustain the bull market and counteract the bearish pressure instigated by profit-taking activities towards the end of April. Notably, following bullish intervention at the $4.5 price level, the market has started to exhibit subtle shifts towards the upside. It is evident that bullish momentum is being gradually established, as exemplified by the recent occurrence of a bullish engulfing pattern on the chart.