Injective (INJ/USD) on Verge of Breakout as Price Tests Channel Limits
Estimated Reading Time: 3 minutes
Don’t invest unless you’re prepared to lose all the money you invest. This is a high-risk investment and you are unlikely to be protected if something goes wrong. Take 2 minutes to learn more
With the Injective Protocol currently range-bound between $23.00 and $27.00, the bullish momentum must overcome the resistance at the $27.00 price level to establish an uptrend. In today’s trading session, there is notable movement, with an almost marubozu candlestick approaching the pivotal $27.00 mark. However, a more comprehensive analysis is required to ascertain whether this renewed bullish momentum will sustain above the resistance level or potentially result in a fakeout.
Injective Protocol Market Data
- INJ/USD Price Now: $25.82
- INJ/USD Market Cap: $2.4 billion
- INJ/USD Circulating Supply: 93 million
- INJ/USD Total Supply: 100 million
- INJ/USD CoinMarketCap Ranking: #49
Key Levels
- Resistance: $27.00, $28.00, and $30.00
- Support: $25.00, $23.00, and $22.00.
Injective Protocol Through the Lens of Indicators
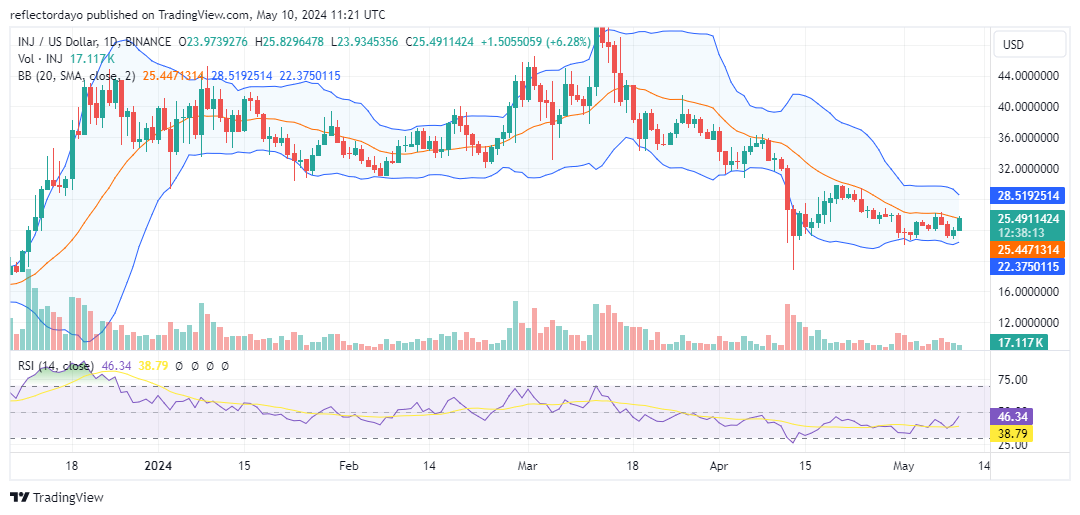
The Injective Protocol market has maintained its movement around the $23.00 price level since encountering strong rejection at $30.00 in April. Subsequently, bearish momentum prevailed, resulting in a shift of the resistance level from $30.00 to $27.00. This anticipated bearish influence on the $23.00 level was countered by resilient bullish activity.
Notably, today’s daily trading session exhibits a surge in bullish momentum, suggesting the potential for breaking the $27.00 resistance level. This surge, combined with the significant contraction of the Bollinger Bands indicator, indicates the possibility of a bullish price surge that could propel the market above this key resistance level. However, considering this crypto signal, it’s essential to acknowledge the potential for a fakeout.
Analysis of the trade volume indicator reveals a smaller histogram accompanying today’s bullish candlestick, even smaller than that of yesterday. This incongruity suggests that the current surge may lack sustainability after surpassing the critical $27.00 price level.
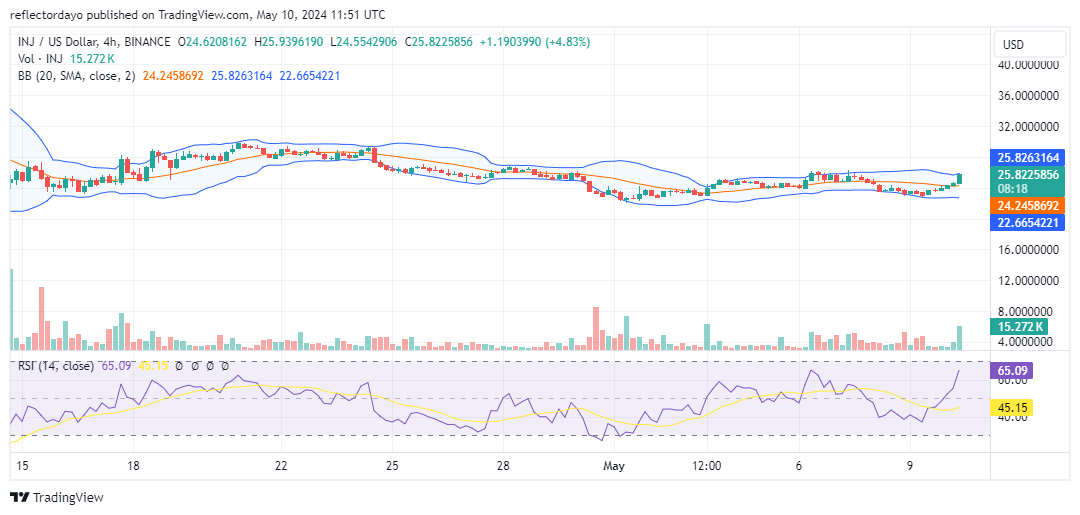
INJ/USD Price Prediction: 4-Hour Chart Analysis
Conversely, a distinct perspective emerges when examining the market through the lens of the 4-hour chart. While the volume of trade histogram portrays strength, the significance of the bullish candlestick in the current 4-hour trading session appears somewhat subdued, contrasting with the robustness implied by the histogram. This discrepancy suggests a potential deceleration in bullish momentum.