EigenLayer (EIGEN/USDT) Approaches a Critical Turning Point Amid Pressure
Estimated Reading Time: 2 minutes
Don’t invest unless you’re prepared to lose all the money you invest. This is a high-risk investment and you are unlikely to be protected if something goes wrong. Take 2 minutes to learn more

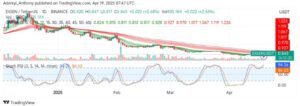
EigenLayer against the Tether in the past weeks has been under sustained bearish pressure, sliding under the descending cluster of Guppy Multiple Moving Averages (GMMAs) regardless of bullish efforts.
However, the recent uptick in volume, price, and the Stochastic RSI hints at a potential shift in momentum as the price moves 2.88% to the north of its opening. To this end, this suggests the pair is preparing to challenge the resistance at $0.927 as bullish traders seek to reclaim the control of the market.
Currently, EigenLayer trades at $0.843, recording over 900 thousand traded volumes for the day already.
Technical Indicators
Major Resistance Levels: $0.927, $1.017, and $1.120
Major Support Levels: $0.800, $0.760, and $0.700
EigenLayer Technical Analysis
The analysis of EigenLayer against Tether on the daily timeframe shows signs of a mean reversion as the price and volume see an increase. However, a close is needed above the long-period EMAs. To this end, a swing play above $0.927 could signal the start of a trend reversal.
On the other hand, the Stochastic RSI signals an overbought situation, but bullish crossovers persist, indicating the determination for short-term momentum. Therefore, if the bulls can push the price above $0.927, a movement above $1.000 would materialize; otherwise, the former trend might continue.
EIGEN/USDT Analysis: Can the Bulls Reclaim Control?
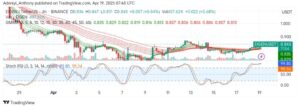
On the 4h chart, EIGEN/USDT has broken above the short-period EMAs, signaling an initial bullish momentum. However, the Stochastic oscillator signals an extreme overbought condition, but the tightened set of EMAs suggests an explosive move is on the way.
To this end, if the bulls can defend the $0.835 support zone, continuation towards $0.927 remains highly probable. Conversely, the pair might experience a pullback to the south due to the oscillator’s overbought condition.
You can purchase crypto coins here. Buy LBlock