Eigenlayer (EIGEN/USDT) Shows Signs of Bullish Reversal as Oversold Condition Triggers Bounce
Estimated Reading Time: 2 minutes
Don’t invest unless you’re prepared to lose all the money you invest. This is a high-risk investment and you are unlikely to be protected if something goes wrong. Take 2 minutes to learn more

The market for EigenLayer against the Tether has been under prolonged bearish pressure for months, after which it is now consolidating. However, the pair seems to be flashing an early sign of potential trend reversal after a prolonged period of sideways movement.
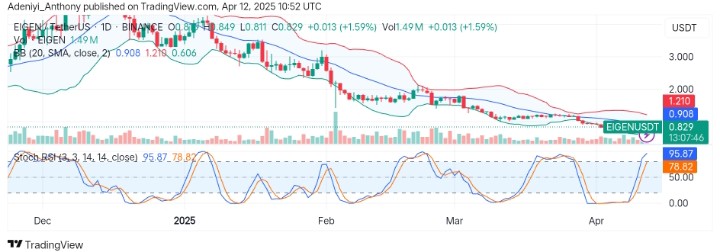
Recently, the pair’s price action appears to be bouncing off its recent lows with increased volume, supported by a breakout attempt from the lower Bollinger bands and an aggressive push to the north in the Stochastic RSI.
To this end, the market is cautiously optimistic, and if momentum is sustained, the pair could reclaim previous highs.
Currently, EigenLayer trades at $0.829 with over 1 million traded volumes for the day.
Technical Indicators
Major Resistance Levels: $0.908, $1.210, and $1.500
Major Support Levels: $0.750, $0.680, and $0.606
EigenLayer Technical Analysis
On the daily timeframe, EigenLayer against the Tether is displaying a short-term bullish reversal play as the price seems to be operating near the dynamic Bollinger band after bouncing off from $0.606 with increased momentum recently.
However, the Stochastic oscillator on the chart shows the pair is overbought, suggesting the increasing buying momentum near the $1.000 level.
To this end, the pair might experience a short-term pullback for a continued move to the north.
EIGEN/USDT Analysis: What’s Happening Here?
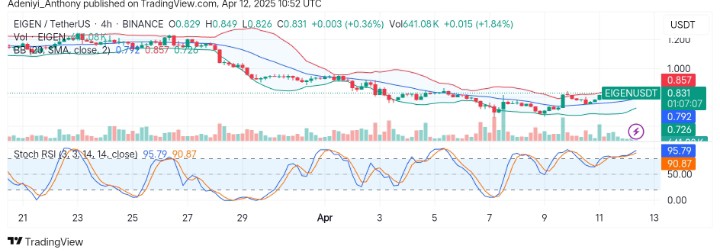
On the 4h chart, EIGEN/USDT appears to be trading above the dynamic Bollinger band as price hit above the $0.792 level with traded volumes more than 600 thousand. This suggests a growing bullish momentum. However, the Stochastic RSI is firmly in the overbought zone, reflecting strong upside momentum, but with the likelihood of a slight pullback in view.
To this end, the current uptick and steady volume in this timeframe show a healthy accumulation. However, with the 20-SMA line acting as a support, a break above $0.908 may materialize with a sustained push.
You can purchase crypto coins here. Buy LBlock