Eigenlayer (EIGEN/USDT) Eyes Potential Reversal After a Prolonged Downtrend
Estimated Reading Time: 3 minutes
Don’t invest unless you’re prepared to lose all the money you invest. This is a high-risk investment and you are unlikely to be protected if something goes wrong. Take 2 minutes to learn more

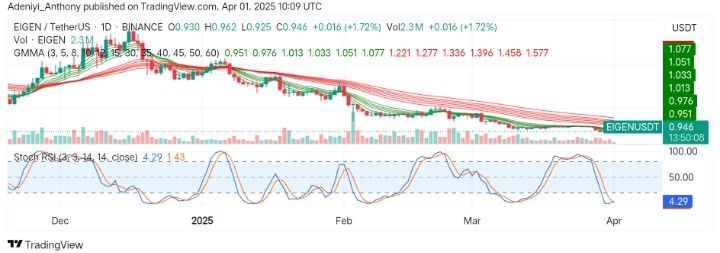
The price action of the Eigenlayer against the Tether crypto pair in the previous market session has been in a clear downtrend since hitting above the $1.000 level in 2024. The Guppy Multiple Moving Averages, on one hand, is showing strong bearish sentiment despite the recent 1.72% upside movement. However, the oversold condition of the Stochastic RSI suggests that the pair may be hinting at a short-term reversal.
To this end, the market has recorded a volume of about 2.3 million, indicating buying interest is increasing with a strong reversal on the horizon as the lines display early entry signs.
Currently, Eigenlayer trades at $0.946, making moves for an upside bounce.
Technical Indicators
Major Resistance Levels: $1.013, $1.100, and $1.200
Major Support Levels: $0.925, $0.900, $0.850
Eigenlayer Technical Analysis
On the daily timeframe, the analysis of Eigenlayer against the Tether shows the pair has been on a clear downtrend as the GMMAs slope towards the southeast. This indicates a strong bearish pressure as the long-period EMAs operate above the short-period EMAs. However, recent price movement shows there has been some demand for the pair as its price advances towards the $1.000 level.
From another angle, the Stochastic RSI currently operates in the oversold zone. However, the movement might indicate selling pressure may be exhausted, as the blue line appears above the orange line.
To this end, the pair is at a critical juncture, with signs of exhaustion from the bears suggesting a possible rebound above the $1.000 level in the near term.
EIGEN/USDT Analysis: What’s Happening Here?
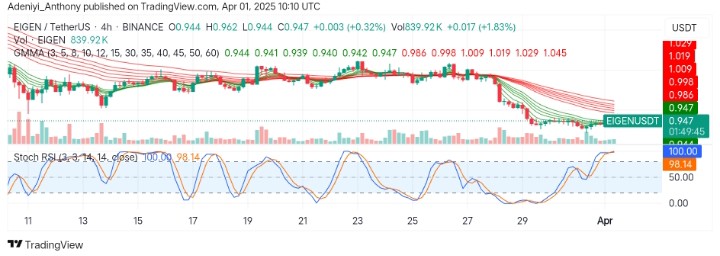
On the 4h chart, the analysis of EIGEN/USDT still reflects a bearish dominance despite an attempt at recovery to the north. The GMMAs in this timeframe signal sellers still exert some pressure on the market as the long-period averages remain above the short-period averages.
The Stochastic RSI, on the other hand, signals buyers’ confidence as the lines read extreme overbought condition as the traded volume nears a million. This indicates a strong bullish momentum in the short term fueled by buyers after suspended bearish actions.
To this end, the market may remain as it is if bullish participation fails to lead to a breakout above $1.019 in the coming sessions.
You can purchase crypto coins here. Buy LBlock


