Eigenlayer (EIGEN/USDT) Sees a Slight Decline in Price
Estimated Reading Time: 2 minutes
Don’t invest unless you’re prepared to lose all the money you invest. This is a high-risk investment and you are unlikely to be protected if something goes wrong. Take 2 minutes to learn more

The market for the crypto pair, Eigenlayer and Tether, has seen a minor fall in price, reflecting a cautious market sentiment. The pair has registered a slight 0.42% drop in price. However, despite the current downturn, the Guppy Multiple Moving Averages (GMMAs) indicate more southbound movement could be imminent, as the Stochastic oscillator signals an overbought condition.
Currently, Eigenlayer trades at $1.173, recording 4.27 million traded volumes today already.
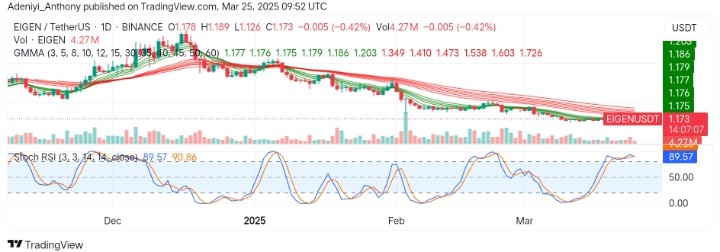
Technical Indicators
Major Resistance Levels: $1.203, $1.349, and $1.726
Major Support Levels: $1.60, $1.126, and $1.000
Eigenlayer Technical Analysis
Eigenlayer against the Tether has experienced a slight downturn, reflecting the ongoing struggle between the market traders. The GMMAs show the sellers are dominating; this indicates the prevailing selling pressure is still strong. While the green band remains under the red EMAs, reinforcing the current bearish momentum.
On the other hand, the Stochastic RSI suggests an overbought condition, and any cross below the current to the south would signal the start of a new price correction.
To this end, the volume indicates heightened bearish activity, and a drop below $1.600 would signal another round of price falls.
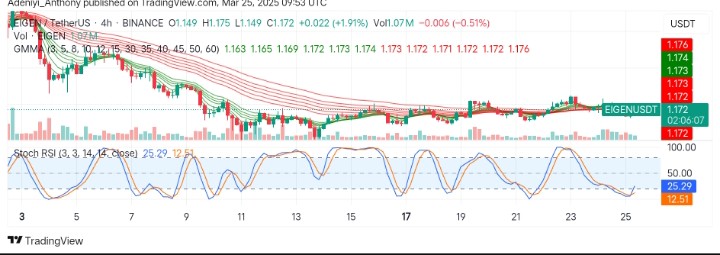
EIGEN/USDT Analysis: What to Expect
On the 4H chart, EIGEN/USDT appears to be gaining as the price sees a gain of 1.91%. However, the overall market sentiments remain bearish with the long-period EMAs still above the short-period EMAs.
The Stochastic oscillator, on the other hand, sits in the oversold zone with the lines pointing upside. To this end, the short-period EMAs and the blue line of the oscillator beneath the chart are beginning to show signs of impending stability or trend reversal. Therefore, a hold above $1.800 in the near term would indicate a rebound; otherwise, a fall below $1.600 might result in further downside movement.
You can purchase crypto coins here. Buy LBlock