Eigenlayer (EIGEN/USDT) Eyes More Bullish Movement
Estimated Reading Time: 2 minutes
Don’t invest unless you’re prepared to lose all the money you invest. This is a high-risk investment and you are unlikely to be protected if something goes wrong. Take 2 minutes to learn more

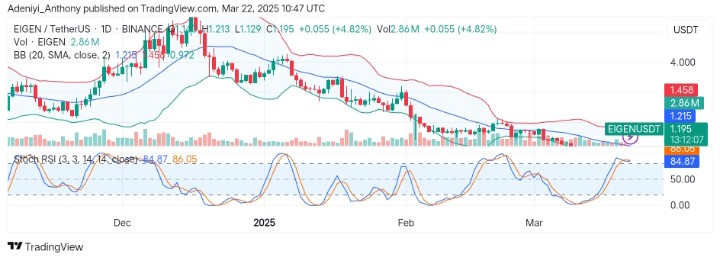
Eigenlayer against the Tether shows signs of a potential bullish breakout after weeks of consolidation. Recently, the price of EigenLayer has climbed to the top by 4.82%, closing above the previous day’s price. This movement comes after a prolonged downtrend that pushed the pair’s price to trade below the critical support level.
However, despite the current move, the overall market sentiment appears to be shifting towards optimism, as seen in the increasing participation in the market.
Currently, EigenLayer trades at $1.195, with over 2 million daily traded volumes.
Technical Indicators
Major Resistance Levels: $1.216, $1.458, and $2.000
Major Support Levels: $1.129, $0.972, and $0.850
Eigenlayer Technical Analysis
The analysis of EigenLayer against the Tether is at a critical juncture. The Bollinger bands indicate the pair is attempting a bullish move, which indicates a possible trend reversal as the price approaches $1.215.
On the other hand, the Stochastic RSI signals an overbought situation. This suggests a potential short-term pullback might occur before another higher move.
To this end, for an upside movement towards $1.458 to occur, the price would need to be elastic to the increase in the trading volume. Conversely, with the oscillator’s claimed short-term pullback, a break below the immediate support line could change the narrative.
EIGEN/USDT Analysis: Expectations
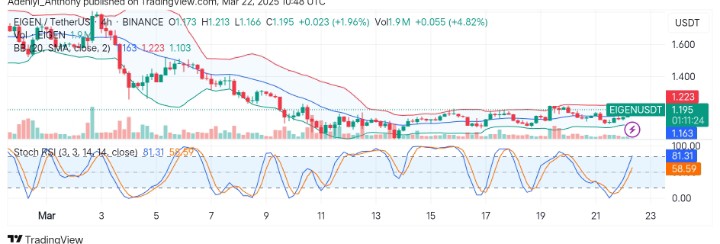
The analysis of the EIGEN/USDT on the 4h chart shows that the pair continues its gradual upside move, marking a 1.98% increase away from the previous session. Currently, the Bollinger bands indicate a squeeze, signaling a potential volatility spike ahead as the price holds within $1.223 resistance and $1.163 support.
On the other hand, the Stochastic oscillator suggests an overbought condition, hinting at a mild pullback before any further gain. To this end, the price must hold above $1.163 to initiate a move to the north.
You can purchase crypto coins here. Buy LBlock