Eigenlayer (EIGEN/USDT) Struggles to Hold at $1.000 for a Reversal
Estimated Reading Time: 3 minutes
Don’t invest unless you’re prepared to lose all the money you invest. This is a high-risk investment and you are unlikely to be protected if something goes wrong. Take 2 minutes to learn more

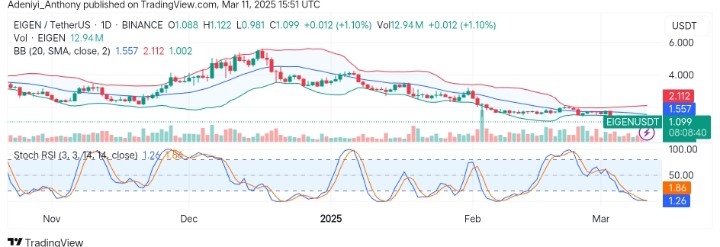
The market for EigenLayer against the Tether has been trending downward since reaching its all-time high of around $5.000, forming lower highs and lows as the pair’s price breaks support levels.
Recently, the air trades just above the lower band of the Bollinger Bands, indicating the existence of intensified selling pressure. However, the oscillator at the bottom of the chart suggests the pair is preparing for a reversal as the lines show signs of a bullish crossover.
Currently, EigenLayer trades at $1.098 with 12.93 million volume traded for the day.
Technical Indicators
Major Resistance Levels: $1.557, $2.112, and $3.000
Major Support Levels: $1.000, $0.900, and $0.500
Eigenlayer Technical Analysis
The analysis of EigenLayer against Tether on a daily chart shows that the pair has been on a prolonged downward trend, evidenced in the repeated formation of lower lows since attaining its highest high earlier this year.
On the other hand, the Stochastic RSI signals an extreme oversold condition for the air as the lines read values less than the 2-mark level. This suggests the pair may see a reversal soon if more bullish traders troop in.
To this end, if the price finds support above the $1.000 level, the movement towards $1.557 may be possible; otherwise, the pair’s price may witness a fall below $0.9000 before another journey to the North.
EIGEN/USDT Analysis: What’s Next?
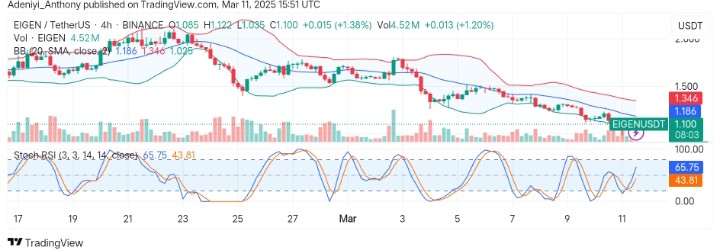
The market for EIGEN/USDT on a 4H chart shows that despite recent attempts to move upside, the mid-line dynamic level has been a tough level to break, bouncing back at every touch.
On the other hand, the Stochastic RSI suggests that EIGEN/USDT is about to make another effort to break above the 20-SMA line as bullish traders flood the market. However, as the line leans upside, the indicator hints at a short-term recovery.
To this end, the price needs to hold above the midline at $1.186 for a potential reversal at $1.500; otherwise, a retracement below $1.000 would lead to a continuation of the current trend.
You can purchase crypto coins here. Buy LBlock