EigenLayer (EIGEN/USDT) Faces Severe Sell-offs
Estimated Reading Time: 3 minutes
Don’t invest unless you’re prepared to lose all the money you invest. This is a high-risk investment and you are unlikely to be protected if something goes wrong. Take 2 minutes to learn more

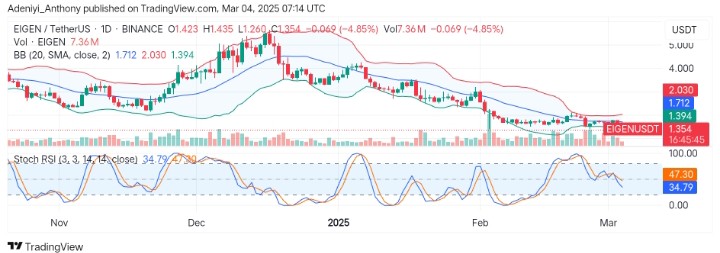
On the daily timeframe, Eigenlayer against Tether has seen a prolonged bearish trend, forming lower highs and lows since the beginning of the year. However, recent price actions show that the price has broken below the lower Bollinger band at $1.394, indicating a serious oversold condition.
Since the formation of an all-time high around $5.000, the pair has been trending to the south, while most of its activities are within the lower segment of the Bollinger band. Despite efforts to record a significant upside movement EIGEN is still acting under strong selling pressure, suggesting a continuation of the trend except when buyers intervene.
Currently, Eigenlayer trades at $1.354, recording over 4% loss with 7.36 million traded volumes for the day.
Technical Indicators
Major Resistance Levels: $1.394, $1.712, and $2.030
Major Support Levels: $1.300, $1.260, and $1.200
Eigenlayer Technical Analysis
The analysis of Eigenlayer against Tether on the daily chart shows that the pair has been on an extended downward movement, breaking below every lower support. The Bollinger band at this point shows that the price is at a critical level as the price trades below its lower segment. However, the price needs to break above $1.394 and $1.712 for a confirmed upside movement; otherwise, the current trend continues.
On the other hand, the Stochastic RSI signals that the pair might extend further to the south, as the lines on the indicator show improvement in that direction. To this end, otherwise, there is a bullish crossover, and the price will continue to move southwards.
EIGEN/USDT Analysis: Where from Here?
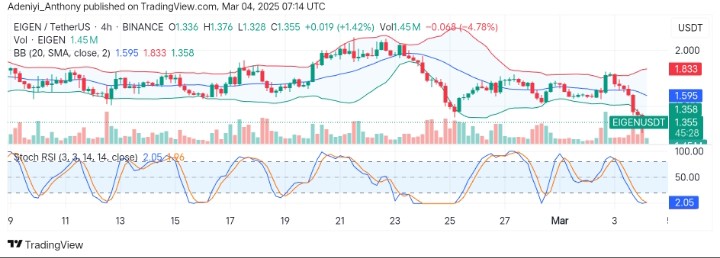
On the 4H timeframe, EIGEN/USDT has declined significantly and is now hovering around the lower Bollinger band at $1.358. The pair needs to break above $1.358 before attempting $1.595, as the pair seems to be recording a minor gain with expanding bands.
The Stochastic RSI on the other side shows that the pair operates in the extreme oversold region with the values of the lines reading below the 3-mark level. However, the curvature of the lines indicates an impending upside movement might be on the horizon.
To this end, if the bullish takes advantage of the current condition, a move above $1.595 may be actualized; otherwise, a break below $1.260 would indicate a further downtrend.
You can purchase crypto coins here. Buy LBlock