EigenLayer (EIGEN/USDT) Extends Bearish Run
Estimated Reading Time: 3 minutes
Don’t invest unless you’re prepared to lose all the money you invest. This is a high-risk investment and you are unlikely to be protected if something goes wrong. Take 2 minutes to learn more

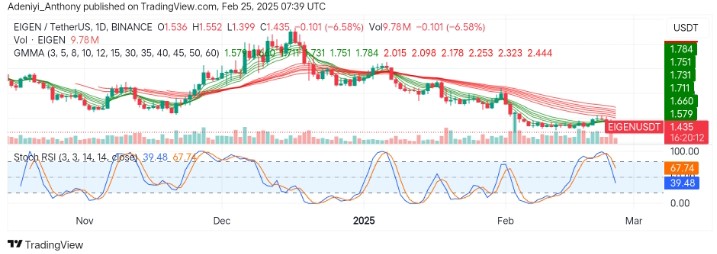
The market for Eigenlayer against the USDT appears to be in a cautiously bearish phase, with the price action trending below the Guppy Multiple Moving Averages (GMMAs). Recently, the pair’s price has been forming lower highs and lows, breaking every possible support. However, the trading volume at 9.78 million remains relatively moderate, suggesting no major surge in price for the main time.
At this juncture, the pair remains in a short-term downtrend, with the bulls waiting for a lower high to regain confidence, while the bears are eyeing major supports if the price fails to reclaim the resistance area.
Currently, Eigenlayer is trading at $1.435, recording a loss of 6.58%.
Technical Indicators
Major Resistance Levels: $1.579, $1.711, and $2.000
Major Support Levels: $1.400, $1.300, and $1.000
Eigenlayer Technical Analysis
The analysis for Eigenlayer against the Tether on the daily timeframe appears to be downward sloping below the clustered GMMAs, suggesting the market is dominated by the bears. However, the downward-facing short-period EMAs suggest the price may see further correction in the near term.
On the other hand, the Stochastic RSI signals a selling pressure as the lines move to the south, indicating the formation of a new low.
To this end, bulls may watch for a potential oversold bounce supported by a convincing Stochastic oscillator’s move to enter the market; otherwise, the price pushes toward the $1.400 psychological level.
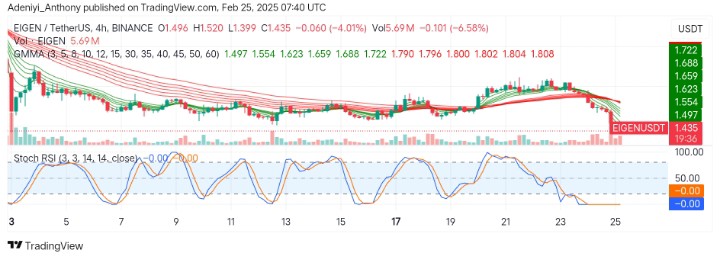
EIGEN/USDT Analysis: What’s Happening Here?
On the 4-hour time frame, EIGEN/USDT showed continued downward pressure as the price continued to trade under the lines of the multiple moving averages. This suggests the bears are still in control as the Stochastic RSI signals the market is in a stabilization phase.
Therefore, a break above the $1.570 resistance level could spark a recovery. Conversely, failure to hold above $1.400 may lead to deeper corrections.
You can purchase crypto coins here. Buy LBlock