Pepe Unchained (PEPU/USD) Market Update: Bulls Retreat to $0.0009, Eye Rebound as Bearish Pressure Weakens
Estimated Reading Time: 3 minutes
Don’t invest unless you’re prepared to lose all the money you invest. This is a high-risk investment and you are unlikely to be protected if something goes wrong. Take 2 minutes to learn more

Amid persistent bearish pressure in the Pepe Unchained (PEPU/USD) market, bullish momentum has receded toward the $0.0009 price level—potentially to consolidate strength for a rebound.
Recent price action suggests a loss of traction on the part of the bears. The chart shows a flattening of the downtrend, indicating that selling pressure may be weakening as the market approaches this key threshold. The inability of sellers to drive prices decisively below $0.0009 signals a potential shift in sentiment.
If the bulls can capitalize on this pause and regain momentum, the market may soon initiate a rally toward higher price levels. For now, $0.0009 stands as a critical support zone that could determine the direction of the next major move.
Key Levels to Watch
- Resistance: $0.0030, $0.0035, $0.004
- Support: $0.0010, $0.0009, $0.0008
Pepe Unchained 4-Hour Chart Outlook: Consolidation Persists as Bearish Momentum Fades
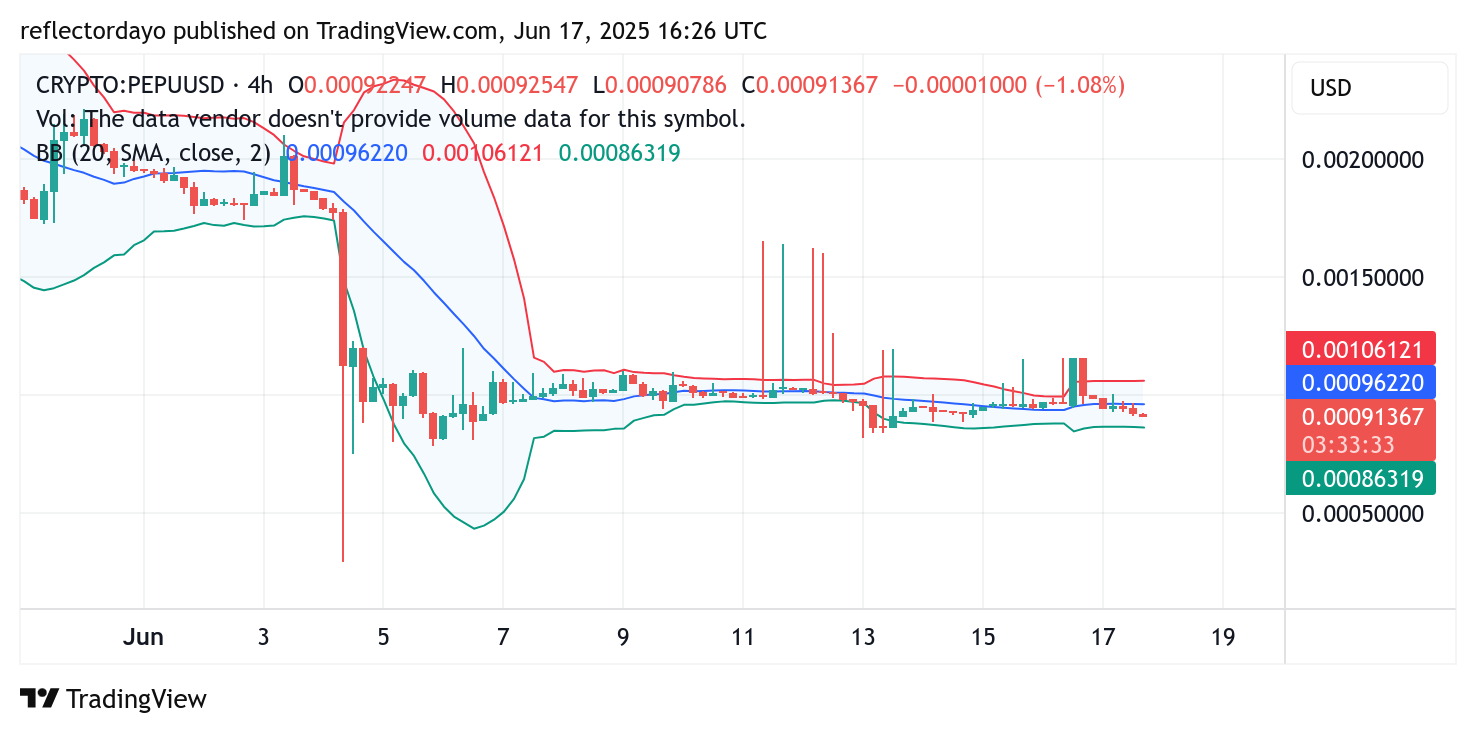
The 4-hour chart for Pepe Unchained (PEPU/USD) reveals ongoing market consolidation, as reflected by the horizontal movement of the Bollinger Bands. The price remains close to the critical $0.001 level, signaling a lack of decisive directional momentum.
Although recent price action has caused a slight divergence in the Bollinger Bands—suggesting a modest uptick in volatility—the overall structure remains largely flat. This mild expansion points to temporary market activity rather than a sustained breakout.
Importantly, the presence of low-volume bearish candlesticks near the current support area indicates that selling pressure is weakening. Combined with the continued horizontal movement of both the price channel and Bollinger Bands, this setup suggests that bearish momentum is fading and a bullish correction could soon follow.
PEPU/USD 1-Hour Chart: Bulls Confront Bearish Control Around $0.001
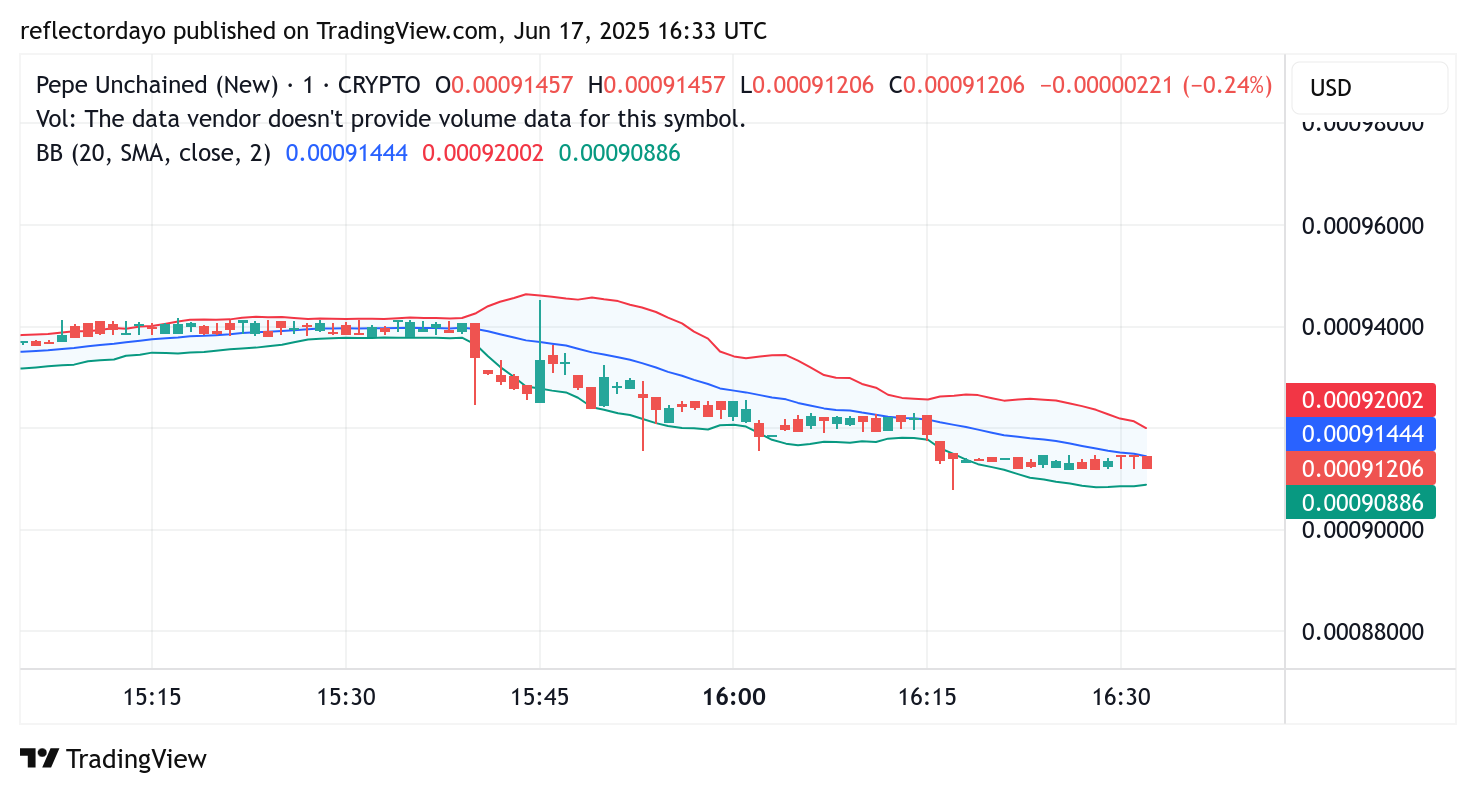
On the 1-hour chart, bearish activity has left a noticeable impact, with the price channel tilting downward in recent sessions. However, the momentum now appears to be shifting, as demand is beginning to clash directly with supply, creating a standoff near the $0.0009 to $0.001 zone.
This struggle between buyers and sellers has temporarily stalled further bearish movement. If bullish traders can maintain their current level of pressure and follow through with consistency, a breakout above the $0.001 threshold may soon unfold—potentially reversing the short-term downtrend and initiating a recovery leg.
Buy PEPUUSD!
🚨 The PumpPad is coming back 🚨$PEPU season begins NOW.🔥
Read about PumpPad V2👇https://t.co/Ai9rnLO0PY pic.twitter.com/UIAfS63iMe
— Pepe Unchained (@pepe_unchained) June 14, 2025
Buy and stake NOW on the L2 for DOUBLE staking rewards! Pepe Unchained (PEPU)