Wall Street Memes (WSM) Prices Hold Stances, Muscling Bounces
Estimated Reading Time: 3 minutes
Don’t invest unless you’re prepared to lose all the money you invest. This is a high-risk investment and you are unlikely to be protected if something goes wrong. Take 2 minutes to learn more
Wall Street Memes Price Prediction – April 7
A prolongation moving proceeds has steadily persistent in the method of ensuring that the Wall Street Memes coins hold stances positively against the market’s valuation of the US currency, as the pairing set up shows that the price is muscling bounces.
Several steps fostering stable gains have emerged, reaffirming bottom formations while preventing bears from extending successive declines within the Bollinger Bands’ trend lines. Buyers should remain confident in the eventual return of recovery pathways over the long run.
WSM/USD Market
Key Levels
Resistance levels: $0.0015, $0.002, $0.0025
Support levels: $0.0008, $0.0006, $0.0004
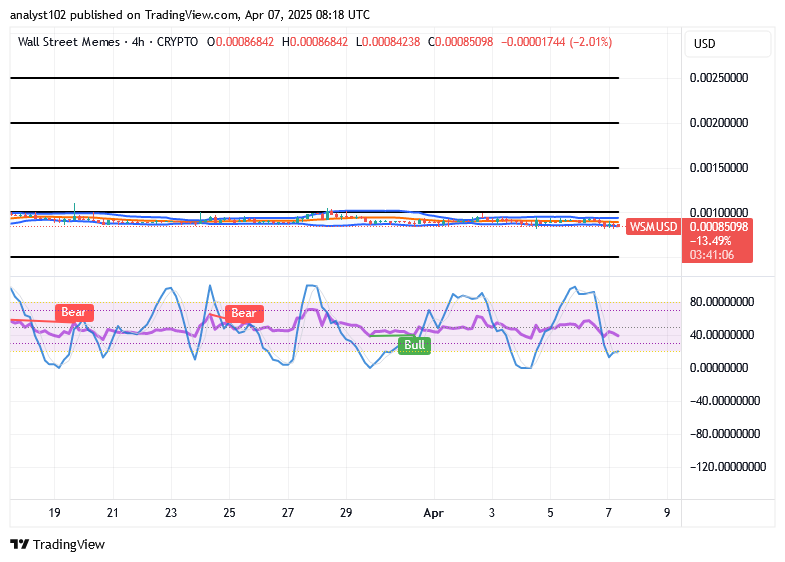
WSM/USD – 4-hour Chart
The WSM/USD medium-term chart pictures that the crypto-economic markets hold stances at the baseline, muscling bounces.
A feeble move to the downside has featured at variant lower ends of the candlesticks, affirming most position entries to execute fresh longing orders around the lower part of the indicators of the Bollinger Bands. The stochastic oscillators have dipped into the oversold zone, signaling a potential upward reversal soon.
With WSM/USD forming lower lows at the lower Bollinger Band, is further downside imminent?
Looking at the pace capacity at which the WSM/USD market is now being surfaced in lower lows style around the trend line of the Bollinger Band, it is possible to see some reductions in other lower lows formats to perfect a sudden rebounding input, given that the crypto trades hold stances, muscling bounces in their overall outlook.
Recouping proceedings have to continue even in the wake of getting to witness any index of southward-moving momentum, as the case may be. Long-term capitalists should endeavor to commit to making their portfolios build on the principle of position accumulations while dipping cycles, marked to prevail ahead of massive bounce-offs.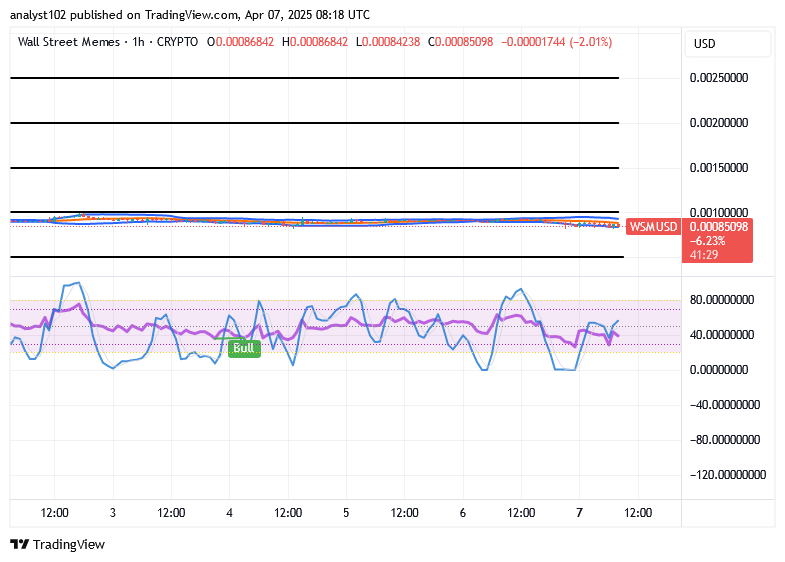
WSM/USD 1-hour chart
The WSM/USD 1-hour chart depicts that the short-term movements of the base crypto-economic markets hold stances on a firmer sign, muscling bounces.
The way the stochastic oscillator is moving gives a hint that WSM/USD traders might bounce back soon from their recent losses. The Bollinger Bands are slightly opening on the lower side, suggesting that sellers might start losing control. If buyers suddenly jump in, the market could turn around quickly.
BIGTIME/USDT & WSM/USDT perpetual contracts are now live on Bybit, offering enhanced liquidity and leverage opportunities!
🚀 BIGTIMEUSDT & WSMUSDT Contracts now on Bybit!
— Bybit (@Bybit_Official) October 12, 2023
Dive into new trading opportunities with 1-25x leverage. Plus, they’re now on Bybit Futures Grid Bot! Start trading now.
📈 BIGTIME: https://t.co/FAQlbhnzAh
📈 WSM: https://t.co/pb2y2AfMBE#CryptoTrading #Bybit