Wall Street Memes (WSM) Trade Is on a Base, Fueling Moves
Estimated Reading Time: 3 minutes
Don’t invest unless you’re prepared to lose all the money you invest. This is a high-risk investment and you are unlikely to be protected if something goes wrong. Take 2 minutes to learn more
Wall Street Memes Price Prediction – April 6
Today’s trading proceedings in the way that the valuation of the Wall Street Memes crypto economy has been featured against the purchasing weight of the American dollar, as both buying and selling activity have led to making the price sets on a base, fueling moves in the settings.
Market actions driving transactional flows in both directions have yet to provide long-term position traders with optimal entry points. Given this outlook, investors should temporarily hold their portfolios steady, allowing for strategic accumulation aimed at securing substantial long-term gains.
WSM/USD Market
Key Levels
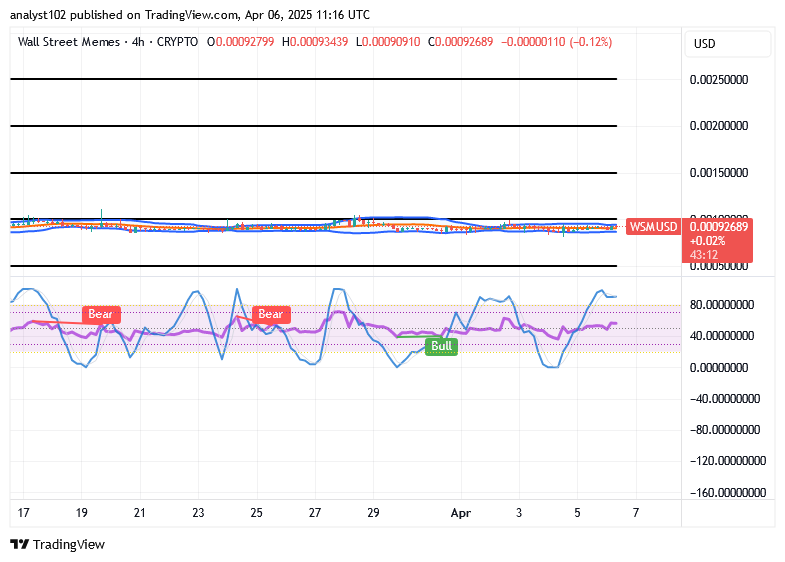
Resistance levels: $0.0015, $0.002, $0.0025
Support levels: $0.0008, $0.0006, $0.0004
WSM/USD – 4-hour Chart
The WSM/USD medium-term chart demonstrates that the crypto-economic business is on a base formation, fueling moves in inputs.
Another phase of minor consolidation before sustained gains may emerge, as stochastic oscillators remain positioned in the overbought region. However, their current alignment supports a bullish continuation. Meanwhile, the Bollinger Bands’ trend lines extend laterally, maintaining their structure around the $0.001 level.
Should WSM/USD investors await a confirmed breakout above $0.001 before increasing position sizing?
It is strictly suggested that the buyers of the WSM/USD market instrument should continue to secure variant spots ahead of the projected breakout of $0.001 to maximize giant profits, given that the crypto-economic trade is on a base, fueling moves.
The WSM/USD trade lines may take a while to leave their current range-bound spots, as the present situation is being depicted from the angle of oscillators and momentum indicators. Given this setup, accumulation within the base instrument is expected to persist, despite its potential to retrace lower in search of a new all-time low, influenced by diminishing liquidity and bearish divergence.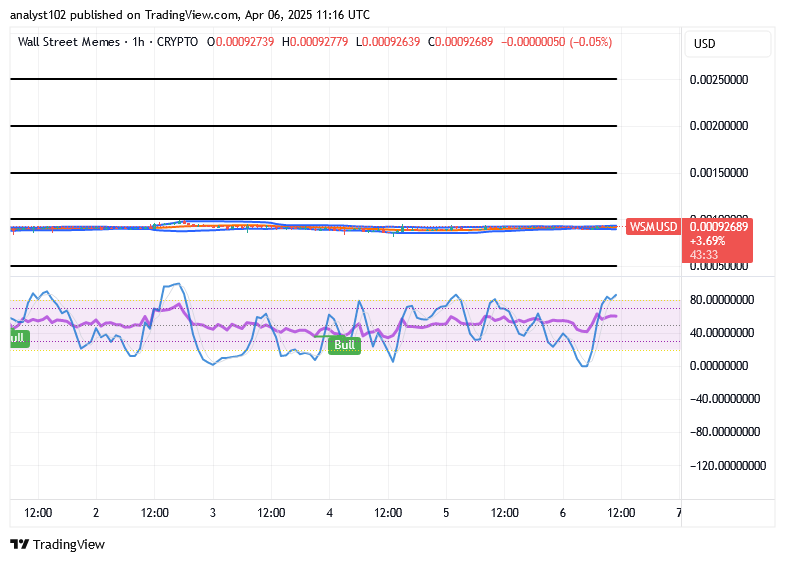
WSM/USD 1-hour chart
The WSM/USD 1-hour chart demonstrates that the short-term pathway of the base crypto-economic price is on a base-building process, fueling moves.
The stochastic oscillators continue to fluctuate between positive and negative thresholds, indicating uncertainty in sustaining a bullish outlook. Meanwhile, the Bollinger Bands’ trend lines have flattened, signaling a prevailing sideways movement in the market.
$WSM community, we registered your market signals and social sentiment!
$WSM community, we saw your Tweets! 👏$WSM / $USDT is now tradeable on #Bybit Perpetuals.
— Bybit (@Bybit_Official) October 13, 2023
Trade here: https://t.co/le4XyVyXaZ
Also want your project listed? Share your suggestions here:https://t.co/W7EWJVVNV5 https://t.co/XgXoL7g0rF